Ecological Archives A025-104-A2
Bharath Ananthasubramaniam, Edward McCauley, Kurt A. Gust, Alan J. Kennedy, Erik B. Muller, Edward J. Perkins, and Roger M. Nisbet. 2015. Relating suborganismal processes to exotoxological and population level endpoints using a bioenergetics model. Ecological Applications 25:16911710. http://dx.doi.org/10.1890/14-0498.1
Appendix B. Supplementary figures on the dynamics and predictions of the bioenergetic model.
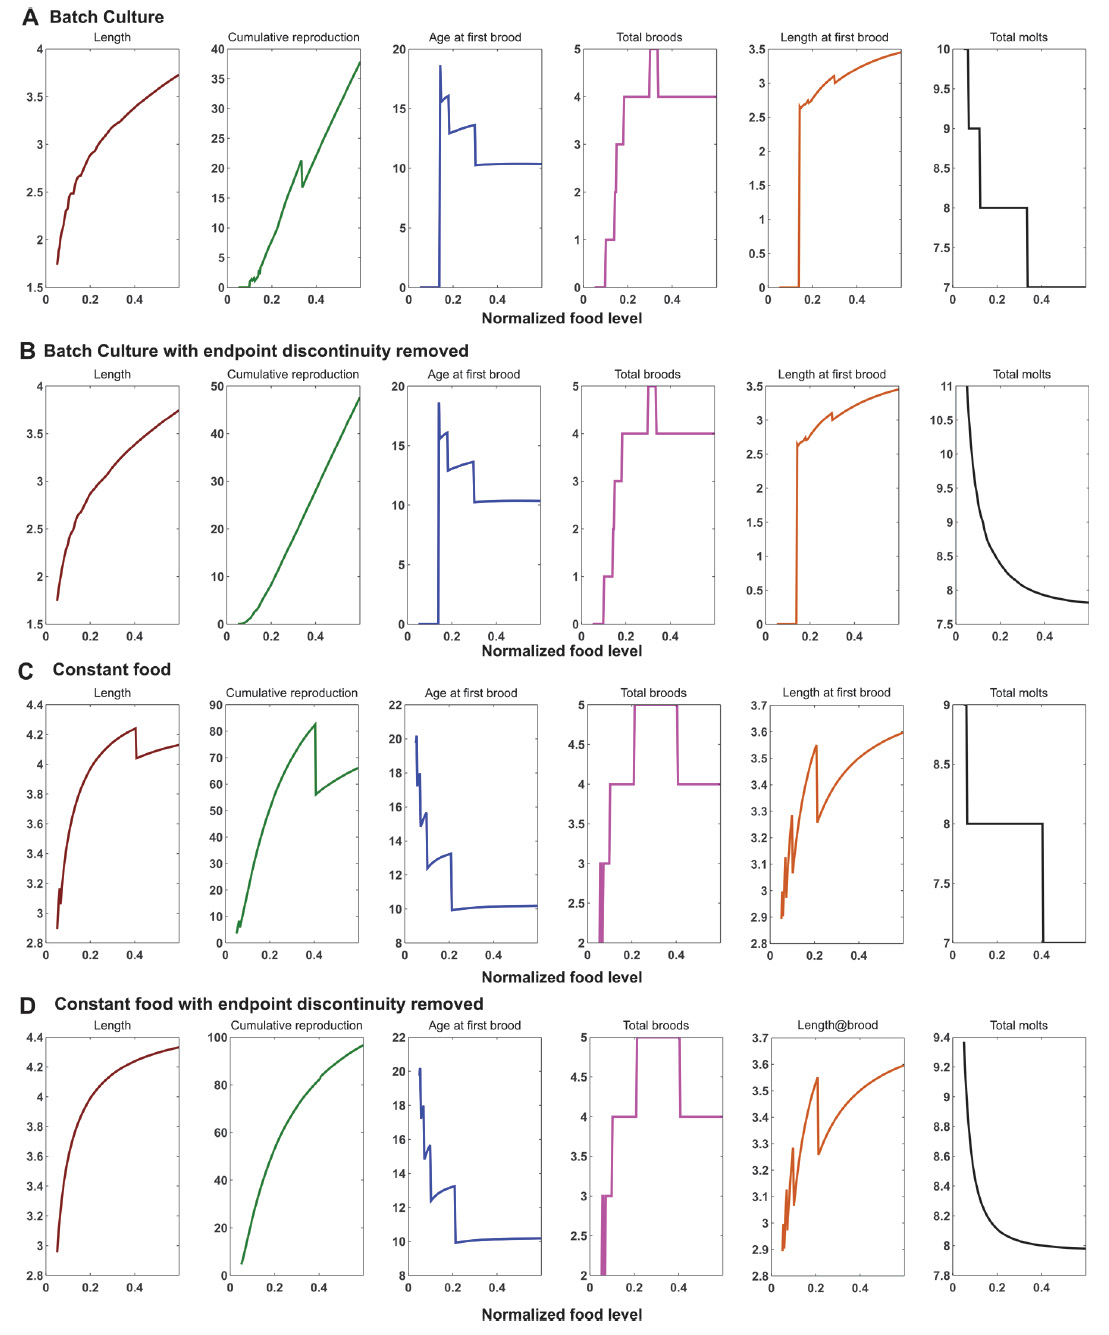
Fig. B1. Smoothened endpoints used for the numerical sensitivity analysis. Each subplot shows one of the six endpoints of interest against the equivalent feeding level (the tunable parameter in our model). The standard unsmoothed output of the model is shown for various input feeding levels for batch cultures (A) and constant food (C). The endpoints in (A) and (C) are smoothed by converting weight and energy allocated to reproduction at the end of the simulation run to update length and cumulative reproduction, respectively (as if a molt occurred), and by defining a continuous total molt metric as the sum of total molts and value of the molt development index at the end of the simulation run. The smoothed endpoint version of (A) and (C) are (B) and (D), respectively.
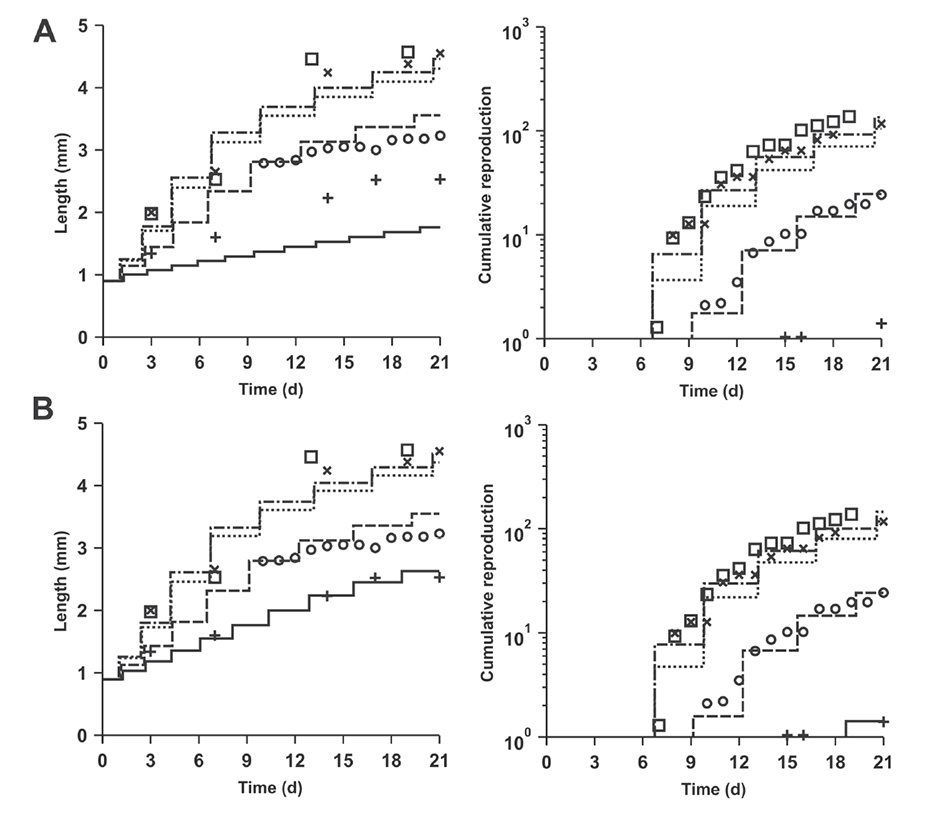
Fig. B2. Comparison of growth and reproduction trajectories over truncated 21-day runs based on semi-chemostat experimental data from Sokull-Klüttgen (1998). [Zoomed in view of Fig. 3 in main text] (A) and (B) are fits to the data using method (1) where feeding level is fixed using cumulative reproduction at 5000 cells/mL after 19 days, and method (2) with fitting each food level individually, respectively (see Methods section in main text for details). (Expt. data: 1000 cells/mL = ‘+’, 5000 cells/mL = ‘o’, 25000 cells/mL =’x’, 100000 cells/mL =square; Model predictions: 1000 cells/mL = solid, 5000 cells/mL = dashed, 25000 cells/mL = dotted, 100000 cells/mL = dash-dotted)