Ecological Archives A025-102-A1
Lance B. McNew and Colleen M. Handel. 2015. Evaluating species richness: Biased ecological inference results from spatial heterogeneity in detection probabilities. Ecological Applications 25:16691680. http://dx.doi.org/10.1890/14-1248.1
Appendix A. Results of simulation analyses to compare species richness estimators under variable detection processes.
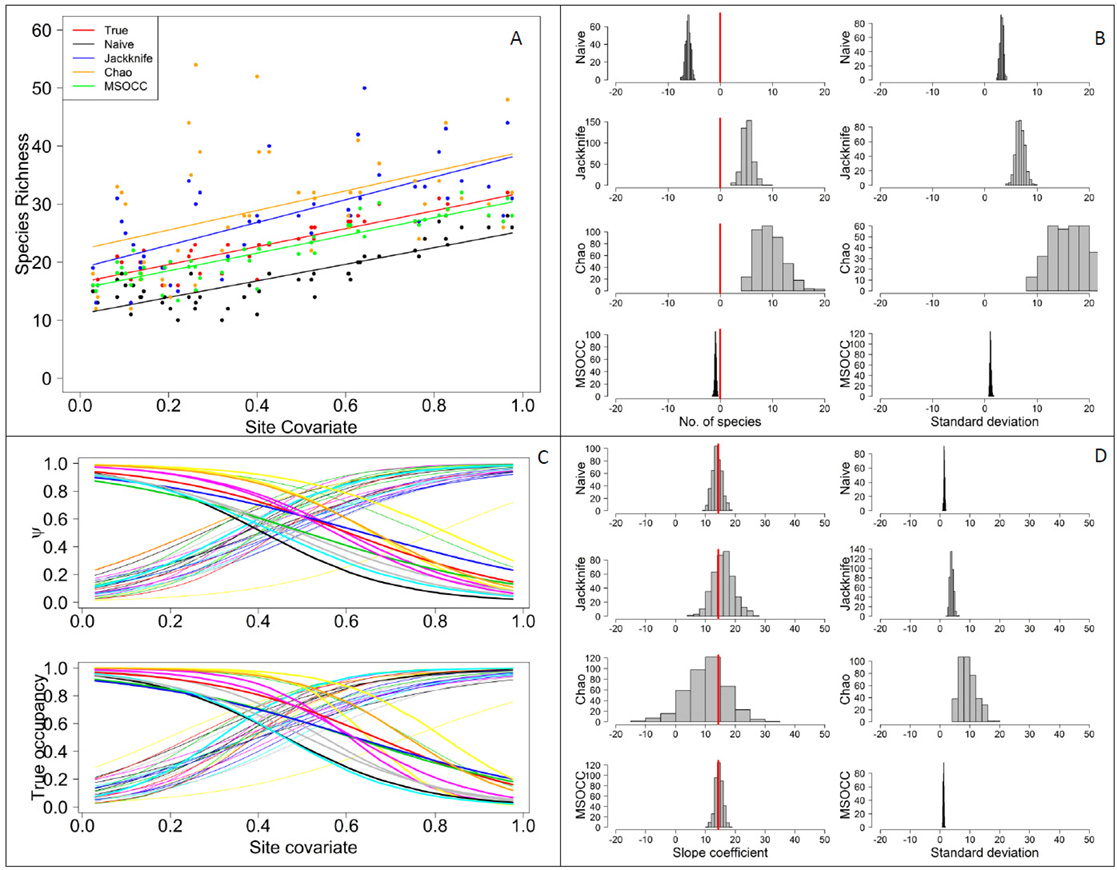
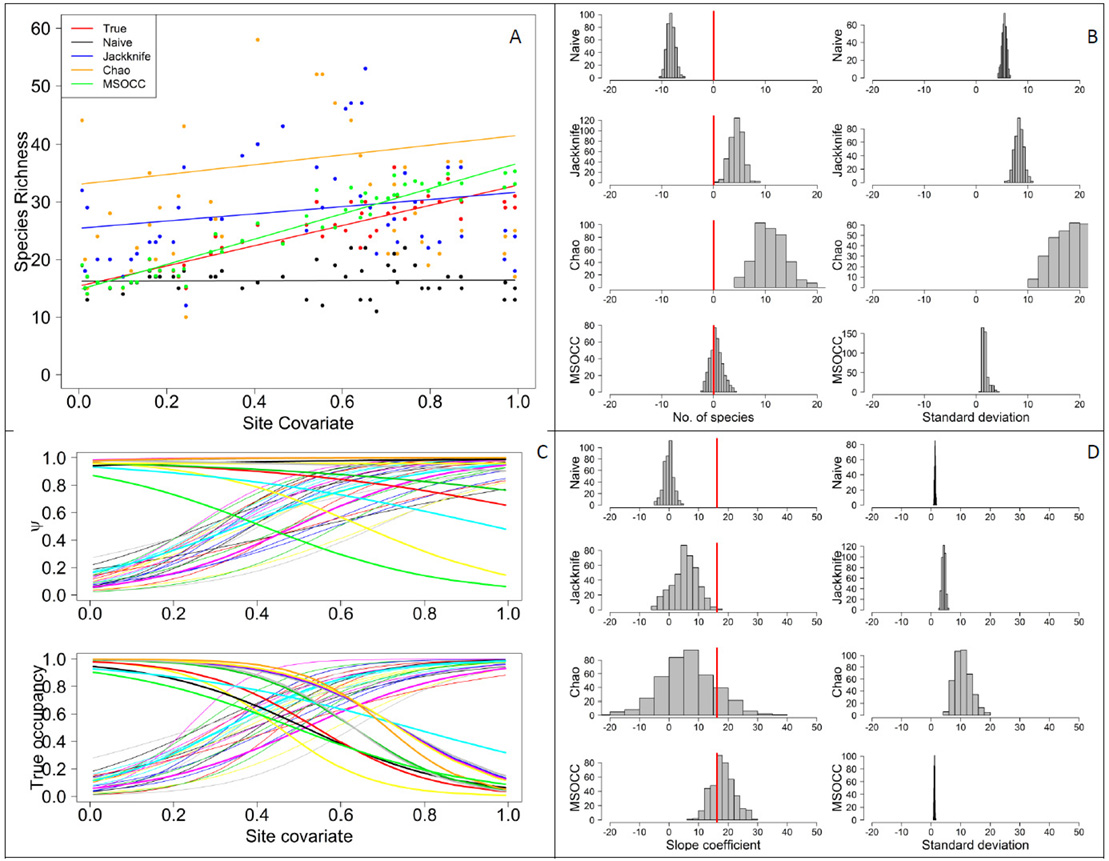
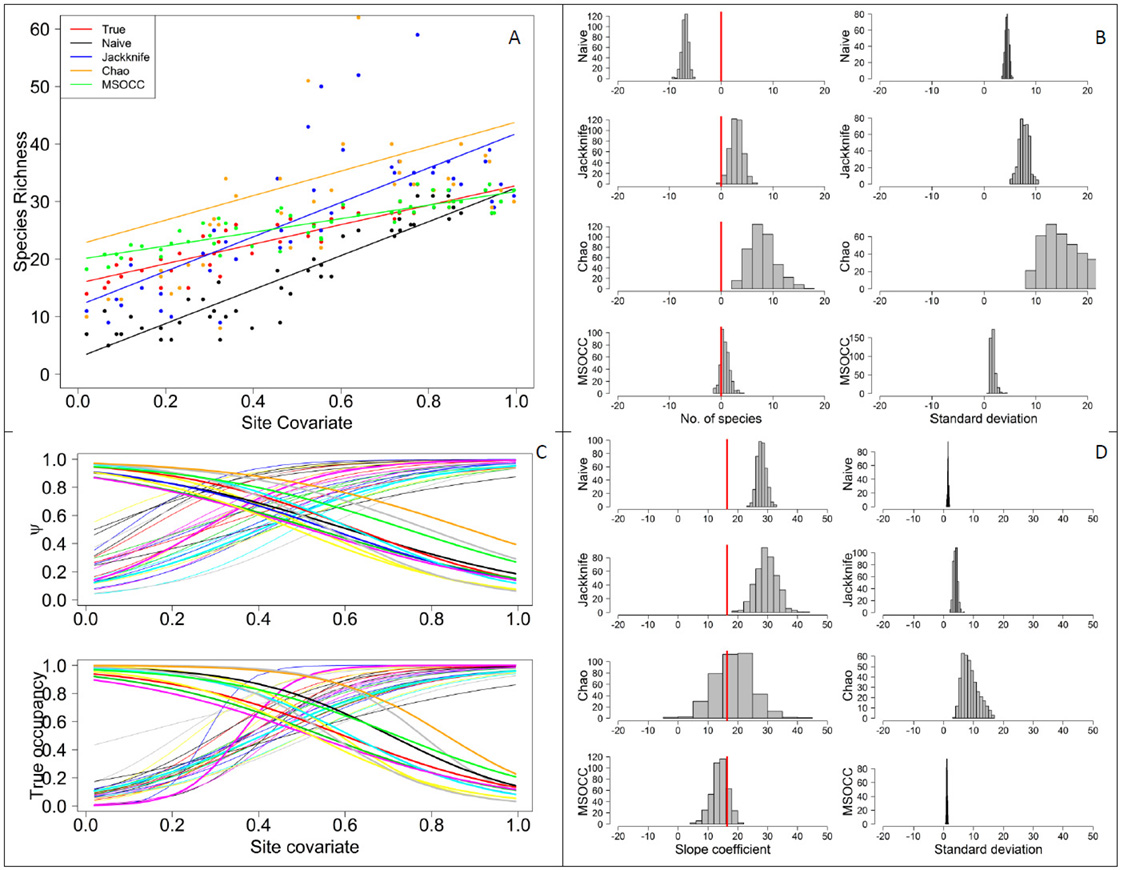
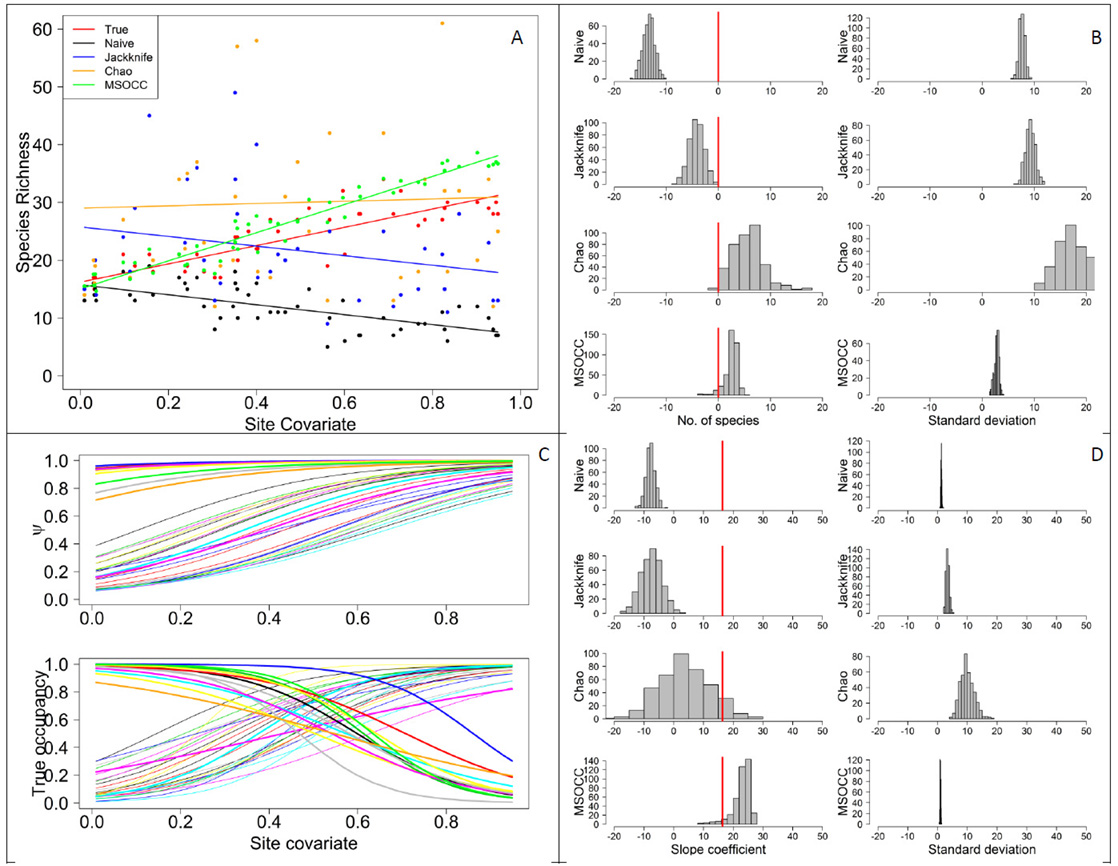
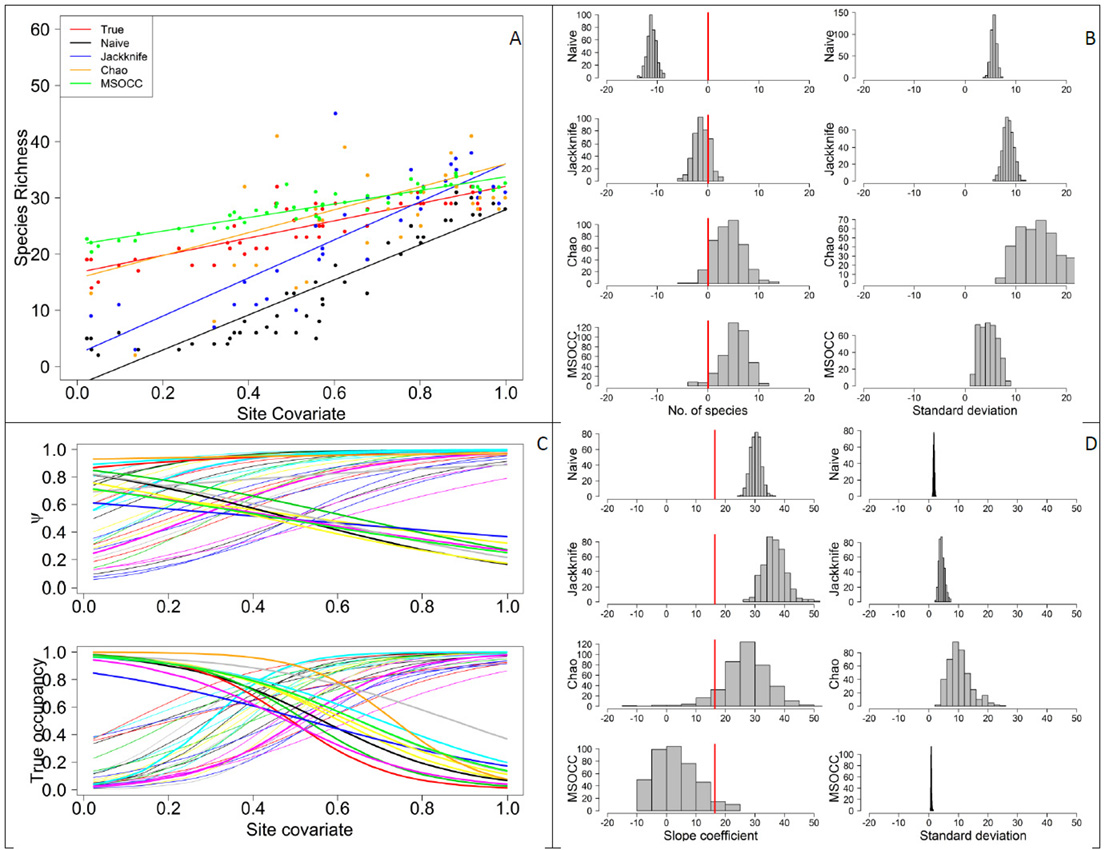
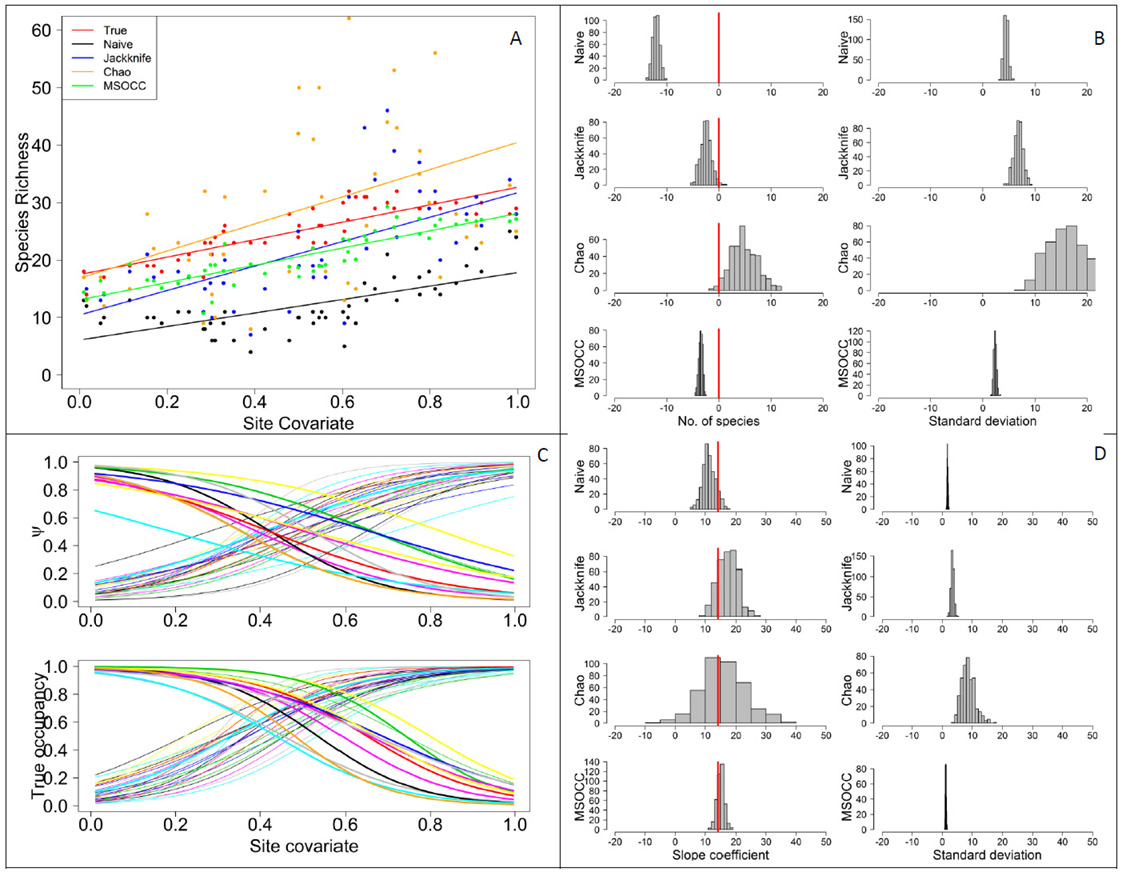
Fig. A1. Results of simulations (n = 400) in which species detection were constant relative to the site covariate and averaged ~0.5 (see Methods for equations). (A) Relationships between four species richness estimators—raw species counts (naïve richness), second order jackknife, Chao, and multi-species occupancy model (MSOCC)—and the hypothetical site covariate. The red line represents the true relationship between local species richness and the site covariate, in which abundance was positively correlated with the covariate for 70% of the species and negatively correlated for 30% of the species. Individual points illustrate true and estimated species richness at each of the 50 sites during one of the 400 simulations. (B) Posterior distributions of mean differences between four estimators of local species richness and true species richness. The red vertical line represents a bias of 0. (C) Species-specific effects of the site covariate on the estimated occupancy (ψ) estimated from the multi-species occupancy model and the true probability of occupancy. Thick lines illustrate 12 species whose abundance was negatively correlated with the site covariate. (D) Bias and precision of the slopes of a linear model of the relationship between local species richness and the site covariate for four estimators of local species richness. The red vertical line represents the slope of the relationship between true species richness and the site covariate.
Fig. A2. Results of simulations (n = 400) in which species detection were constant relative to the site covariate and averaged ~0.75 (see Methods for equations). See Fig. A1 for descriptions of panels A–D.
Fig. A3. Results of simulations (n = 400) in which species detection probabilities decreased with the hypothetical site covariate and averaged ~0.65 (α = 2 ± 0.1; β = -4 ± 0.3; see Methods for equations). See Fig. A1 for descriptions of panels A–D.
Fig. A4. Results of simulations (n = 400) in which species detection probabilities increased with the hypothetical site covariate and averaged ~0.65 (α = -2 ± 0.1; β = 4 ± 0.3; see Methods for equations). See Fig. A1 for descriptions of panels A–D.
Fig. A5. Results of additional simulations (n = 400) in which species detection probabilities decreased with the hypothetical site covariate and averaged ~0.42 (α = 1 ± 0.1; β = -4 ± 0.3; see Methods for equations). See Fig. A1 for descriptions of panels A–D.
Fig. A6. Results of additional simulations (n = 400) in which species detection probabilities increased with the hypothetical site covariate and averaged ~0.42 (α = -3 ± 0.1; β = 4 ± 0.3; see Methods for equations). See Fig. A1 for descriptions of panels A–D.
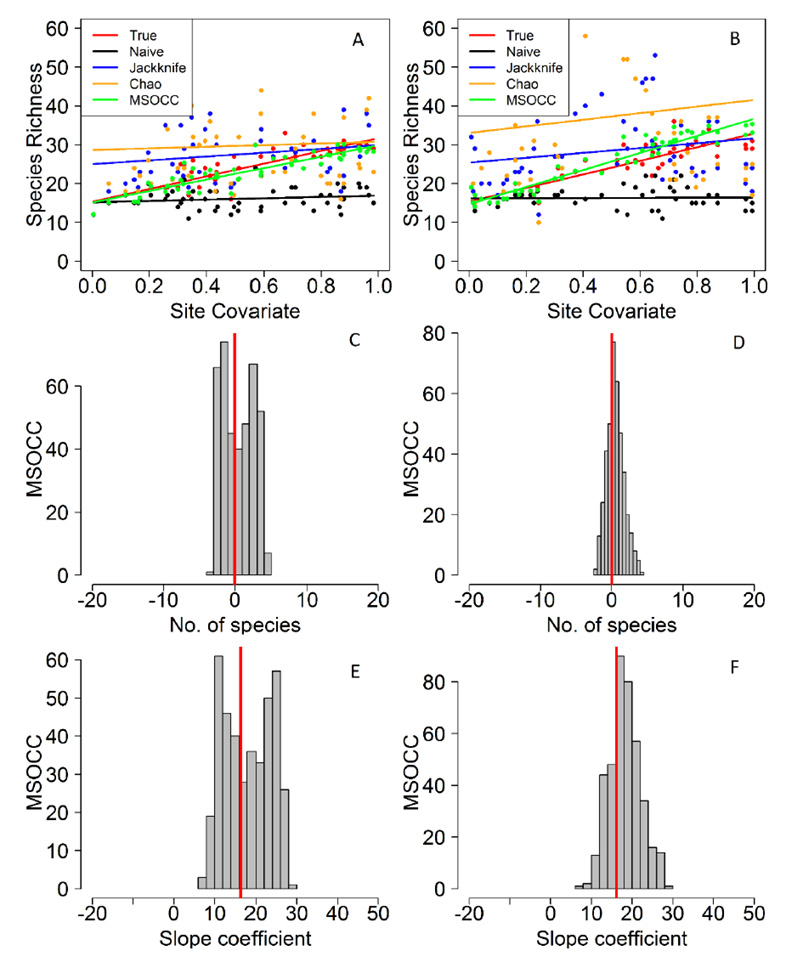
Fig. A7. Comparison of MSOCC performance for (A,C,E) two replicate surveys per site and (B,D,F) three replicate surveys per site. Simulations (n = 400) in which species detection probabilities decreased with the hypothetical site covariate and averaged ~0.65 (α = 2 ± 0.1; β = -4 ± 0.3; see Methods for equations). (A & B) Relationships between four species richness estimators—raw species counts (naïve richness), second order jackknife, Chao, and multi-species occupancy model (MSOCC)—and the hypothetical site covariate. (C & D) Posterior distributions of mean differences between estimated species richness from the MSOCC model and true species richness when (C) two and (D) three surveys were available. The red vertical line represents a bias of 0. (E & F) Bias and precision of the slopes of a linear model of the relationship between local species richness and the site covariate for the MSOCC estimates of local species richness when (E) two and (F) three replicate surveys were available. The red vertical line represents the slope of the relationship between true species richness and the site covariate.
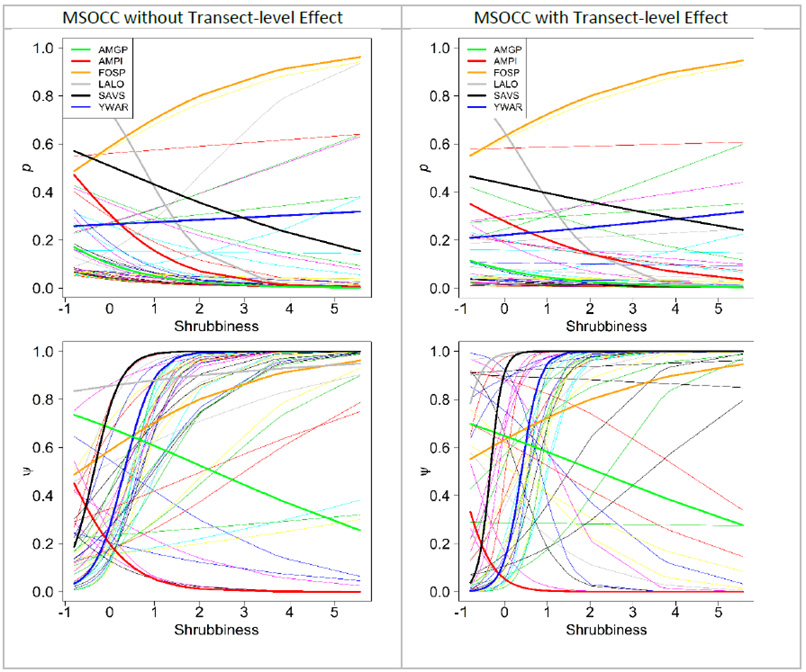
Fig. A8. Comparison of results from multiseason occupancy models without (left column) and with (right column) a transect-level random effect. Species-specific effects of shrubbiness on probabilities of detection (p) and occupancy (ψ) were estimated from the multi-species occupancy model for 48 species observed during point counts on the Seward Peninsula, Alaska, during 21 May – 10 June 2012. A few species-specific relationships are highlighted. AMGP = American Golden Plover (Pluvialis dominica), AMPI = American Pipit (Anthus rubescens), FOSP = Fox Sparrow (Passerella iliaca), LALO = Lapland Longspur (Calcarius lapponicus), SAVS = Savannah Sparrow (Passerculus sandwichensis), YWAR = Yellow Warbler (Setophaga petechia).