Ecological Archives A025-096-A3
Momoko Ichinokawa, Hiroshi Okamura, Chikako Watanabe, Atsushi Kawabata, and Yoshioki Oozeki. 2015. Effective time closures: quantifying the conservation benefits of input control for the Pacific chub mackerel fishery. Ecological Applications 25:15661584. http://dx.doi.org/10.1890/14-1216.1
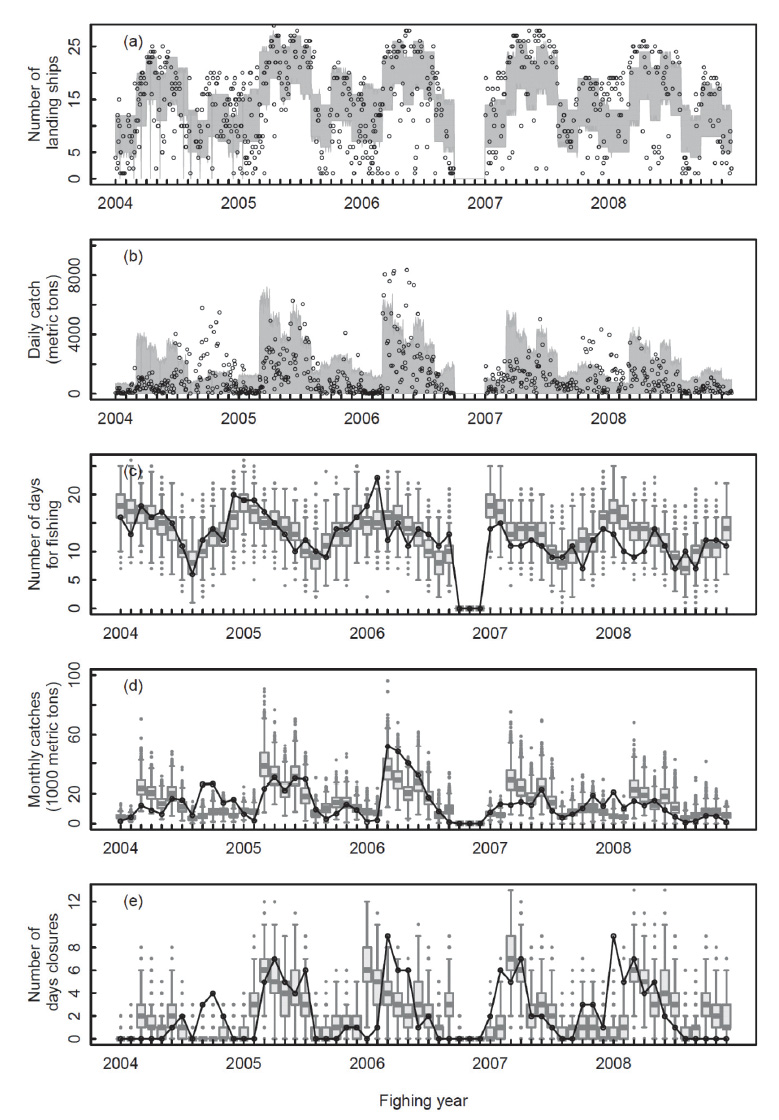
Appendix C. Diagnostics figure to show daily catches and effort when using simple GLM.
Fig. C1. Simulated distributions of (a) dailly number of landing ships, (b) daily catch when mackerel was fished, (c) monthly total number of days when mackerel was fished, (d) monthly total catch, and (e) monthly total number of day closures. Those results are based on the estimated parameters by simple GLM for all statistical models.
Table C1. 90%confidence set of the 0/1 model and estimated parameters. AICc: bias-corrected Akaike Information Criteria; ΔAICc: differences of AICc from the minimum AICc; AW: Akaike weights; CAW: cumulative Akaike weights; Avg.: averaged model.
|
|
Intercept |
log(cbiom) |
log(pbiom) |
pC |
pF |
MON 2 |
MON 3 |
MON 4 |
MON 5 |
MON 6 |
MON 7 |
MON 8 |
MON 9 |
MON 10 |
MON 11 |
MON 12 |
1 |
a2 |
-2.33 |
0.44 |
- |
- |
-0.38 |
-0.10 |
0.06 |
-0.10 |
-0.33 |
-0.46 |
-0.93 |
-1.18 |
-0.93 |
-0.60 |
-0.69 |
-0.23 |
2 |
|
-2.17 |
0.51 |
-0.10 |
- |
-0.38 |
-0.10 |
0.06 |
-0.10 |
-0.33 |
-0.46 |
-0.93 |
-1.17 |
-0.93 |
-0.61 |
-0.70 |
-0.23 |
3 |
a3 |
-2.38 |
0.45 |
- |
-0.12 |
-0.37 |
-0.10 |
0.07 |
-0.09 |
-0.33 |
-0.46 |
-0.93 |
-1.18 |
-0.94 |
-0.60 |
-0.69 |
-0.23 |
4 |
|
-2.22 |
0.51 |
-0.09 |
-0.09 |
-0.37 |
-0.10 |
0.07 |
-0.10 |
-0.33 |
-0.46 |
-0.93 |
-1.18 |
-0.94 |
-0.61 |
-0.70 |
-0.24 |
Avg. |
a1 |
-2.29 |
0.47 |
-0.04 |
-0.03 |
-0.38 |
-0.10 |
0.06 |
-0.10 |
-0.33 |
-0.46 |
-0.93 |
-1.18 |
-0.93 |
-0.60 |
-0.69 |
-0.23 |
|
AICc |
ΔAICc |
AW |
CAW |
1 |
2592.0 |
0.00 |
0.44 |
0.44 |
2 |
2593.0 |
1.05 |
0.26 |
0.70 |
3 |
2593.7 |
1.70 |
0.19 |
0.89 |
4 |
2594.9 |
2.87 |
0.11 |
1.00 |
Avg. |
- |
- |
- |
- |
Table C2. 90%confidence set of the ship model and estimated parameters. AICc: Akaike Information Criteria; ΔAICc: differences of AICc from the minimum AICc; AW: Akaike weights; CAW: cumulative Akaike weights.
|
|
Intercept |
log(cbiom) |
log(pbiom) |
pC |
pF |
MON 2 |
MON 3 |
MON 4 |
MON 5 |
MON 6 |
MON 7 |
MON 8 |
MON 9 |
MON 10 |
MON 11 |
MON 12 |
1 |
b2 |
-7.23 |
0.52 |
0.44 |
- |
- |
0.16 |
1.50 |
2.00 |
1.47 |
2.20 |
1.69 |
0.05 |
-0.16 |
0.54 |
0.73 |
-0.01 |
2 |
a3 |
-7.15 |
0.52 |
0.42 |
0.22 |
- |
0.15 |
1.49 |
2.00 |
1.47 |
2.20 |
1.69 |
0.07 |
-0.15 |
0.56 |
0.75 |
0.00 |
3 |
|
-7.18 |
0.52 |
0.44 |
- |
-0.06 |
0.16 |
1.50 |
2.00 |
1.47 |
2.20 |
1.70 |
0.07 |
-0.15 |
0.55 |
0.74 |
-0.01 |
4 |
|
-7.07 |
0.52 |
0.43 |
0.26 |
-0.08 |
0.14 |
1.48 |
2.00 |
1.46 |
2.20 |
1.70 |
0.09 |
-0.13 |
0.58 |
0.76 |
0.00 |
5 |
|
-5.12 |
- |
0.64 |
- |
- |
0.17 |
1.49 |
1.98 |
1.46 |
2.20 |
1.72 |
0.09 |
-0.15 |
0.52 |
0.72 |
-0.02 |
6 |
|
-5.06 |
- |
0.62 |
0.20 |
- |
0.16 |
1.48 |
1.98 |
1.46 |
2.19 |
1.72 |
0.10 |
-0.14 |
0.53 |
0.74 |
-0.01 |
7 |
|
-5.10 |
- |
0.64 |
- |
-0.07 |
0.17 |
1.49 |
1.98 |
1.46 |
2.20 |
1.73 |
0.11 |
-0.14 |
0.52 |
0.73 |
-0.02 |
8 |
|
-6.38 |
0.82 |
- |
- |
- |
0.17 |
1.47 |
1.96 |
1.45 |
2.19 |
1.69 |
0.09 |
-0.17 |
0.47 |
0.69 |
-0.06 |
Avg. |
b1 |
-6.87 |
0.46 |
0.45 |
0.09 |
-0.02 |
0.16 |
1.49 |
2.00 |
1.47 |
2.20 |
1.70 |
0.07 |
-0.15 |
0.55 |
0.74 |
-0.01 |
|
ρ1 |
ρ2 |
AICc |
ΔAICc |
AW |
CAW |
1 |
0.34 |
0.35 |
1308.1 |
0.00 |
0.30 |
0.30 |
2 |
0.33 |
0.35 |
1308.8 |
0.70 |
0.21 |
0.51 |
3 |
0.34 |
0.35 |
1309.7 |
1.56 |
0.14 |
0.65 |
4 |
0.34 |
0.34 |
1309.9 |
1.75 |
0.12 |
0.77 |
5 |
0.34 |
0.36 |
1311.4 |
3.25 |
0.06 |
0.83 |
6 |
0.34 |
0.36 |
1312.3 |
4.17 |
0.04 |
0.87 |
7 |
0.34 |
0.36 |
1312.7 |
4.62 |
0.03 |
0.90 |
8 |
0.34 |
0.37 |
1312.8 |
4.69 |
0.03 |
0.93 |
Avg. |
0.35 |
0.36 |
- |
- |
- |
- |
Table C3. 90%confidence set of the catch model and estimated parameters. AICc: Akaike Information Criteria; ΔAICc: differences of AICc from the minimum AICc; AW: Akaike weights; CAW: cumulative Akaike weights; Avg.: averaged model.
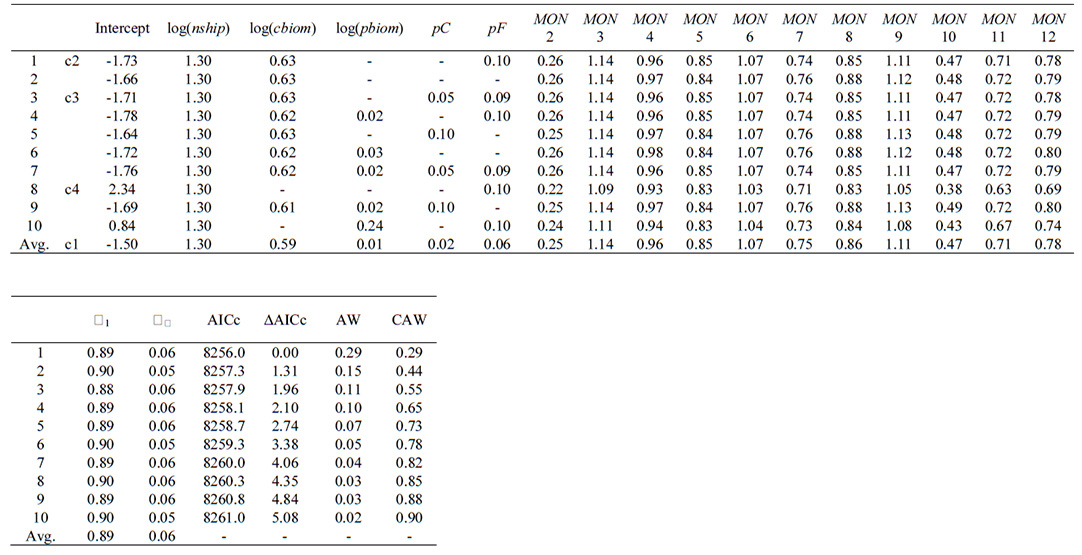
Table C4. 90%confidence set of the closure A model and estimated parameters. AICc: Akaike Information Criteria; ΔAICc: differences of AICc from the minimum AICc; AW: Akaike weights; CAW: cumulative Akaike weights; Avg.: averaged model.
|
|
Intercept |
D |
ppC |
log(cbiom) |
AICc |
ΔAICc |
AW |
CAW |
1 |
|
-0.14 |
1.54 |
- |
- |
161.82 |
0.00 |
0.31 |
0.31 |
2 |
|
-0.21 |
1.57 |
1.35 |
- |
162.03 |
0.20616 |
0.28 |
0.59 |
3 |
|
6.53 |
1.56 |
- |
-1.03 |
162.63 |
0.8058 |
0.21 |
0.80 |
4 |
|
6.79 |
1.58 |
1.38 |
-1.08 |
162.76 |
0.93607 |
0.20 |
1.00 |
Avg. |
|
2.59 |
1.56 |
0.65 |
-0.43 |
- |
- |
- |
- |
Table C5. 90%confidence set of the closure B model and estimated parameters. AICc: Akaike Information Criteria; ΔAICc: differences of AICc from the minimum AICc; AW: Akaike weights; CAW: cumulative Akaike weights; Avg.: averaged model.
|
|
Intercept |
D |
ppC |
log(cbiom) |
pC |
AICc |
ΔAICc |
AW |
CAW |
1 |
|
-3.83 |
-1.97 |
6.50 |
- |
2.92 |
198.42 |
0.00 |
0.37 |
0.37 |
2 |
|
-10.67 |
-1.84 |
6.44 |
1.05 |
2.84 |
198.98 |
0.55 |
0.28 |
0.65 |
3 |
|
-5.45 |
- |
6.30 |
- |
2.58 |
199.89 |
1.47 |
0.18 |
0.83 |
4 |
|
-12.79 |
- |
6.24 |
1.14 |
2.51 |
200.02 |
1.60 |
0.17 |
1.00 |
Avg. |
|
-7.55 |
-1.25 |
6.40 |
0.49 |
2.77 |
- |
- |
- |
- |