Ecological Archives A025-088-A3
Chi Xu, Milena Holmgren, Egbert H. Van Nes, Fernando T. Maestre, Santiago Soliveres, Miguel Berdugo, Sonia Kéfi, Pablo A. Marquet, Sebastian Abades, and Marten Scheffer. 2015. Can we infer plant facilitation from remote sensing? A test across global drylands. Ecological Applications 25:14561462. http://dx.doi.org/10.1890/14-2358.1
Appendix C. Identification of individual plants and point pattern analysis.
The most direct approach to study the spatial association is to simply analyze the distances between individual plants. The point pattern analysis with Ripley's L function has been commonly used to detect spatial correlation structures of individual plants over a range of distance scales, by projecting each individual plant as one point with X/Y coordinates onto a 2D surface. Whether a pattern is random, under-dispersed, or over-dispersed at a specific scale can be determined by comparing the L-function value from observed data with Monte-Carlo envelopes from multiple simulations of a null model (complete spatial randomness, CSR, is usually adopted as the null model) (Wiegand and Moloney 2004). A fundamental step prior to this analysis is accurately positioning individual plants. However, in most sites, the presence of coalescing plant canopies made it impossible to clearly identify individuals from Google EarthTM images. Only 5 of the 65 study sites suggested distinguishable solitary plants, where each isolated dark patch likely represented one single individual (Fig. C1). For these sites, the patches were extracted from the classification results of the Google EarthTM images (see Appendix B) and then converted to the polygon vector format. The geometric center of each patch was identified, and the generated centroid points subsequently entered the point pattern analysis using PASSaGE 2 software (Rosenberg and Anderson 2011). The point extraction procedure was performed using ArcGIS 10.0.
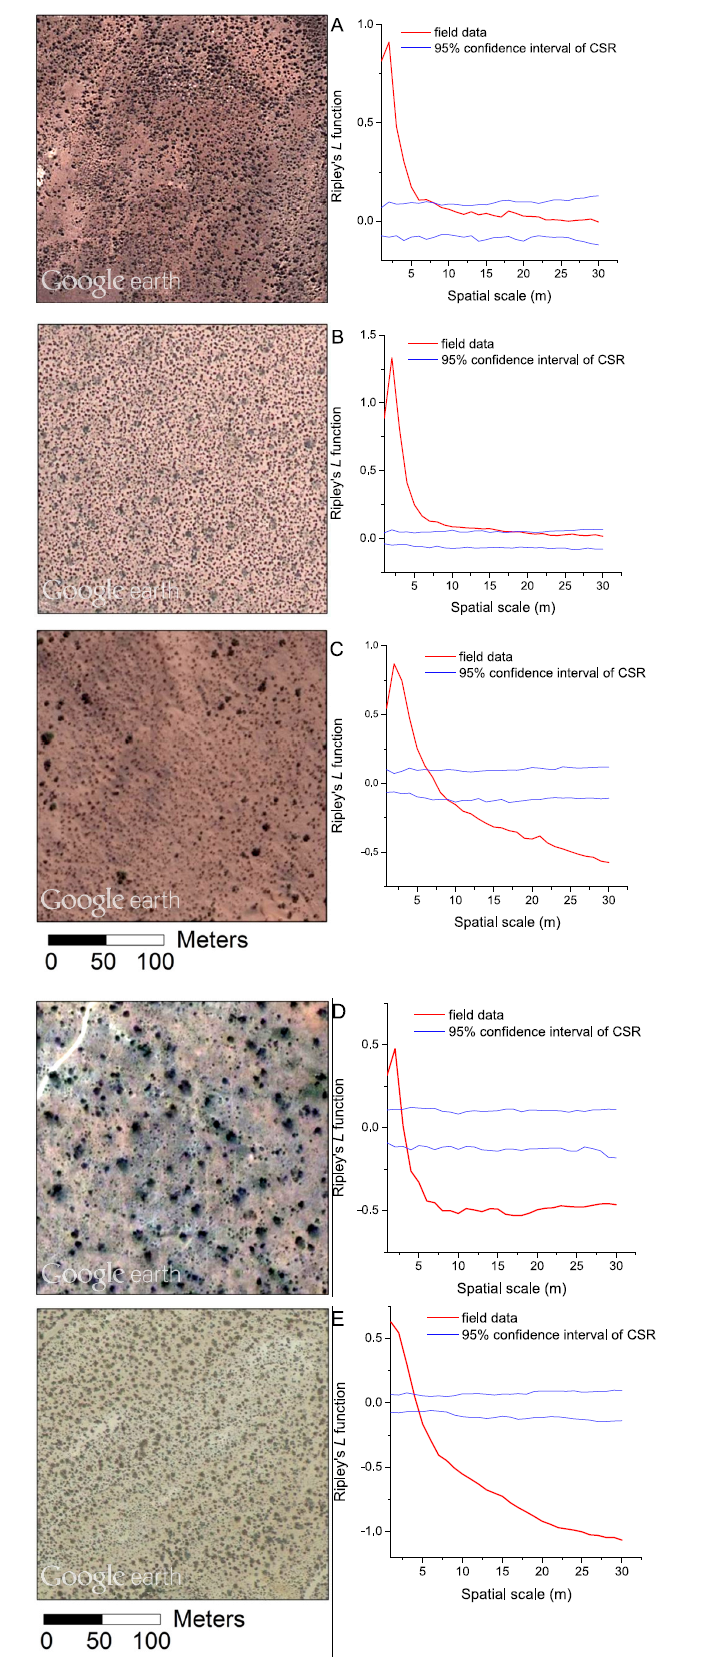
Using point pattern analyses we can analyze spatial associations across scales. In two of the sites studied, such analyses indicate that at large scales (roughly > 10 m) the plants are distributed randomly, whereas at small scales (roughly < 10 m) the plants are significantly more clustered than expected (Fig. C1A, B). This suggests that facilitation plays a role only at smaller spatial scales. At the other three sites, we found the same significant clustering at small scales, but an over-dispersed distribution at larger scale, suggesting that, at small distances, facilitation is important whereas competition between groups of plants dominates the vegetation patterns at larger scales (Fig. C1C–E).
Fig. C1. Point pattern analysis for five drylands with seemingly distinguishable individual plants. Solitary plants within the plots of 250 × 250 m² are distinguished using Google EarthTM images (left column). Ripley's L function is calculated for the field data (red lines) and null model (complete spatial randomness, CSR, blue lines).
Literature cited
Rosenberg, M. S., and C. D. Anderson. 2011. PASSaGE: pattern analysis, spatial statistics and geographic exegesis. Version 2. Methods in Ecology and Evolution 2:229–232.
Wiegand, T., and K. A. Moloney. 2004. Rings, circles, and null‐models for point pattern analysis in ecology. Oikos 104:209–229.