Ecological Archives A025-071-A1
Raphaël Arlettaz, Sébastien Nusslé, Marjana Baltic, Peter Vogel, Rupert Palme, Susanne Jenni-Eiermann, Patrick Patthey, and Michel Genoud. 2015. Disturbance of wildlife by outdoor winter recreation: allostatic stress response and altered activityenergy budgets. Ecological Applications 25:11971212. http://dx.doi.org/10.1890/14-1141.1
Appendix A. A table showing the number of samples analyzed for estimating the concentration of fecal corticosterone metabolites obtained from snow burrows, a figure showing the method for extracting activity budgets from radio-tracking data, and a figure showing the relationship between respiratory metabolism and ambient temperature obtained from captive birds in the lab.
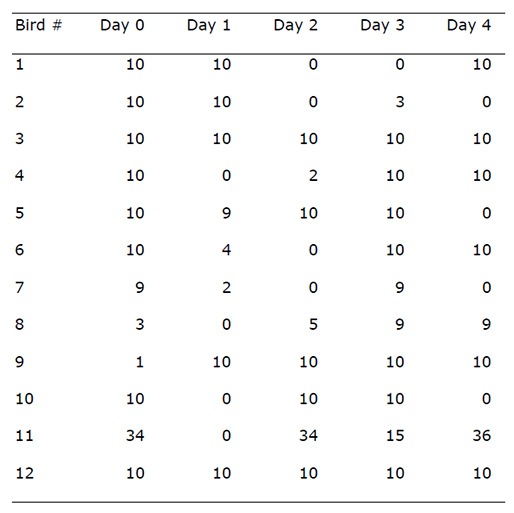
Table A1. Number of fecal samples analysed for estimating the concentration of stress hormone metabolites with respect to bird and experimental day (day numbers refer to the schematic view in Fig. 2).
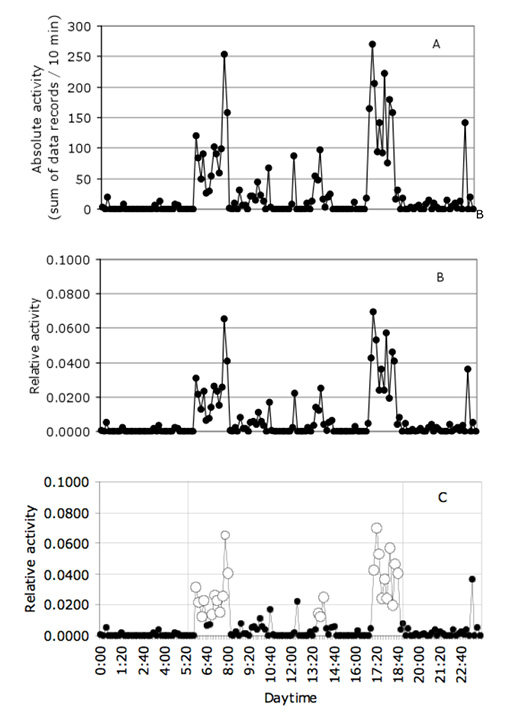
Fig. A1. Example of an absolute activity curve (A), relative activity proportion curve (B) and activity budget curve (C) for one bird in Les Diablerets on 12th March (144 daily data points, i.e., 10 min periods); white circles in C represent feeding sequences. The two vertical lines in C show daylight interval boundaries. Phases of activity corresponded almost exclusively to foraging, as backed by field visual observations.
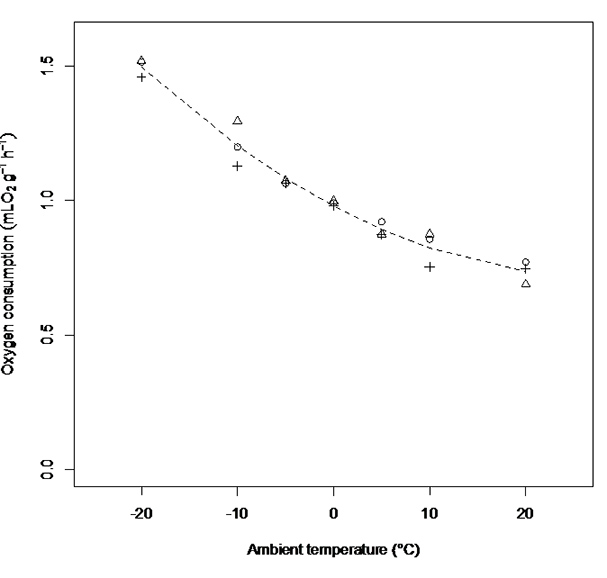
Fig. A2. Modeling of the rate of oxygen consumption as a function of ambient temperature.
We used a linear mixed model (LMM) to model rate of oxygen consumption as a function of ambient temperature for three captive black grouse cocks (different symbols on figure). We considered the factor individual as a random term, ambient temperature as a fixed term and used residual maximum likelihood estimation. Measurements made on black grouse in Finland (Rintamäki et al., 1983) have shown that the lower edge of the thermoneutral zone is close to 20°C, thus we used values obtained at this Ta (756 ± 55 mL O2 h-1) as an estimate of the basal rate of metabolism. Within the range of experimental ambient temperatures, the effect of Ta (fixed effect) on the rate of metabolism can be represented by the following quadratic equation (dashed line): VO2 = 0.97860 – 0.01898 Ta + 0.00034 (Ta)2, with standard errors of 0.01691, 0.00066 and 0.00005 for the three parameters, respectively, all of them being significant (all p < 0.01). Excluding the values at 20°C would have only a minor effect on the above relationship. The residuals of the model were normally distributed (Shapiro-Wilk test, W = 0.97, p = 0.72).