Ecological Archives A025-070-A1
Brandon M. Collins, Jamie M. Lydersen, Richard G. Everett, Danny L. Fry, and Scott L. Stephens. 2015. Novel characterization of landscape-level variability in historical vegetation structure. Ecological Applications 25:11671174. http://dx.doi.org/10.1890/14-1797.1
Appendix A. Summary of topographic variables, derived canopy cover, and large tree density distributions.
Table A1. Summary of topographic/moisture availability variables used to predict the distribution of historical vegetation structure groups across the landscape.
Variable |
mean |
range |
Elevation (m) |
1393 |
776–2140 |
Slope (%) |
9.1 |
0.7–39.2 |
Aspect (cosine transformed) |
9.6 |
0.4–19.5 |
Topographic relative moisture index |
30.4 |
12.5–49.8 |
Actual Evapotranspiration (mm) |
450 |
276–565 |
Annual climatic water deficit (mm) |
261 |
70–394 |
|
N transects |
|
Topographic position (categorical, by majority area) |
Valley bottom |
22 |
Gentle slope |
32 |
|
Steep slope |
228 |
|
Ridge |
12 |
|
Table A2. Estimated canopy cover for the nine historical vegetation groups identified from the k-means cluster analysis. Estimates were derived using the Forest Vegetation Simulator (Dixon 2002), which projects the percentage of ground area directly covered with tree crowns. This estimation corrects for crown overlap, based on species specific equations for crown radius (Dixon 2002).
Vegetation structure group |
n |
Derived canopy cover (%) |
Shrub |
27 |
0.1 |
Low BA, high shrub |
48 |
9.4 |
Low BA, small trees |
31 |
11.6 |
PIPO, low BA, high CHFO |
44 |
15.7 |
PIPO, high BA, mod CHFO |
41 |
23.8 |
PIPO-CADE, low CHFO |
60 |
17.3 |
Mixed-conifer, large trees |
24 |
28.3 |
PSME, mod shrub |
16 |
20.3 |
ABIES, large trees |
3 |
20.3 |
Average* |
267 |
17.2 |
Species codes are as follows: CHFO-Chamaebatia foliolosa, ABCO-Abies concolor, ABMA-A. magnifica, CADE-Calocedrus decurrens, PILA-Pinus lambertiana, PIPO-P. ponderosa, and PSME-Pseudotsuga menziesii.
*does not include the shrub group in the reported averages
Table A3. Mean elevation and actual evapotranspiration (AET) for areas with and without historical inventory data inside the study area boundary (see Fig. 1). To allow for comparison, means were computed for entire quarter-quarter sections (QQs), as opposed to the estimated transects surveyed as in Table A1. Note that there are two less QQs than there were transects analyzed (n = 294). This is due to fact that the 1911 inventory transects on two of the QQs were broken into two separate observations (individual datasheets).
Variable |
With historical data |
Without historical data |
Number of QQs |
292 |
722 |
Elevation (m) |
1393* |
1481 |
AET (mm) |
423 |
417 |
*denotes statistically significant means based on randomization tests (see Methods)
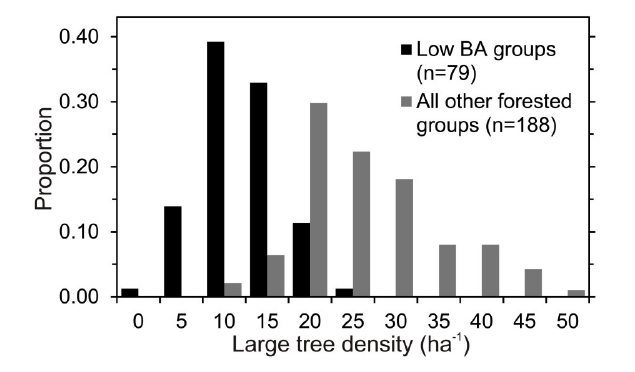
Fig. A1. Proportion of historical inventory transects by large tree (>61 cm dbh) density class. Low basal area (BA) vegetation groups, as identified by our cluster analysis, are separated from all other forested transects.
Literature cited
Dixon, G. E. 2002. Essential FVS: a user's guide to the Forest Vegetation Simulator. Internal Report. Fort Collins, Colorado, USA 209 p.