Ecological Archives A025-068-A1
Vanessa M. Adams and Samantha A. Setterfield. 2015. Optimal dynamic control of invasions: applying a systematic conservation approach. Ecological Applications 25:11311141. http://dx.doi.org/10.1890/14-1062.1
Appendix A. Detailed information of habitat suitability model for gamba grass used in this study.
We compiled all available spatial data sets of environmental variables that could be associated with habitat suitability. We then investigated the trends in gamba grass density across predictor ranges. Gamba grass density maps were compiled based on aerial surveys undertaken between 2008 and 2012 The density was recorded over 250 m grids as a measure of percent cover in one of five classes: 1 = absent, 2 < 1%, 3 = 1–10%, 4 = 10–50%, 5 > 50%. We maintained these density classes for the purpose of modeling habitat suitability but condensed categories 2 and 3 into a single category ('scattered') for the purposes of our simulation modelling and cost estimates.
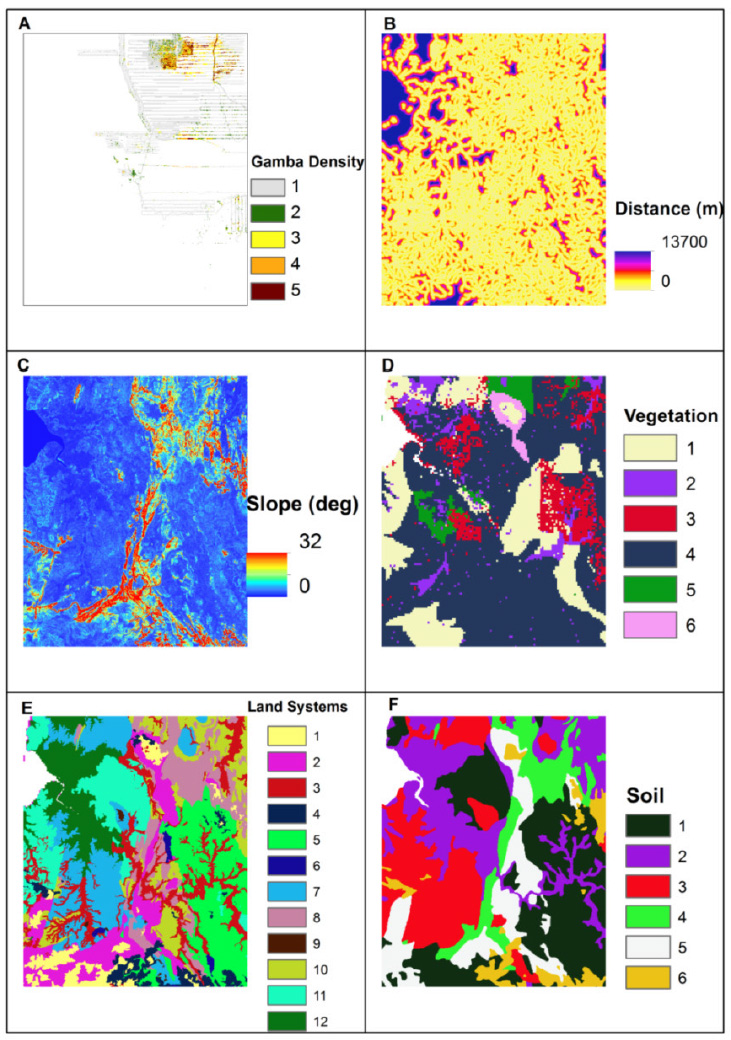
For our study region the available data layers that were consistently mapped across the region and appropriate for inclusion in a habitat suitability model were: land systems (12 classes), soil type (6 classes), vegetation class (6 classes), streams and elevation (Fig. A1, Table A1).
Fig. A1. Gamba grass distribution and predictors used for habitat suitability modeling. (A) Mapped density distribution across region. (B) Distance in meters to stream. (C) Slope in degrees. (D) Vegetation type. (E) Land Systems type. (F) Soil type.
Table A1. Summary of predictors used.
Variable |
Description |
Mean and range |
Distance to stream |
Distance to stream. Surrogate measure of soil moisture. |
418 (0-3301) |
Slope |
Slope. Measure of terrain. |
2.73 (0-17.73) |
Land system class |
1=elevated plateaux surfaces |
N/A |
Vegetation class |
1=Eucalypt Open Forest |
N/A |
Soil class |
1=Kandasols, massive earths |
N/A |
We summarized predictor variables across all density classes to examine data trends. Density of gamba grass declines with distance from stream and higher slopes (Table A2).
Table A2. Summary of distance and slope for survey data.
Density class |
Average of distance (m) |
Max of distance (m) |
Average of slope (degrees) |
Max of Slope (degrees) |
1 |
457 |
3293 |
2.04 |
29.50 |
2 |
483 |
2458 |
2.01 |
19.75 |
3 |
475 |
2317 |
2.25 |
20.10 |
4 |
425 |
2317 |
1.91 |
17.98 |
5 |
354 |
1852 |
1.91 |
17.38 |
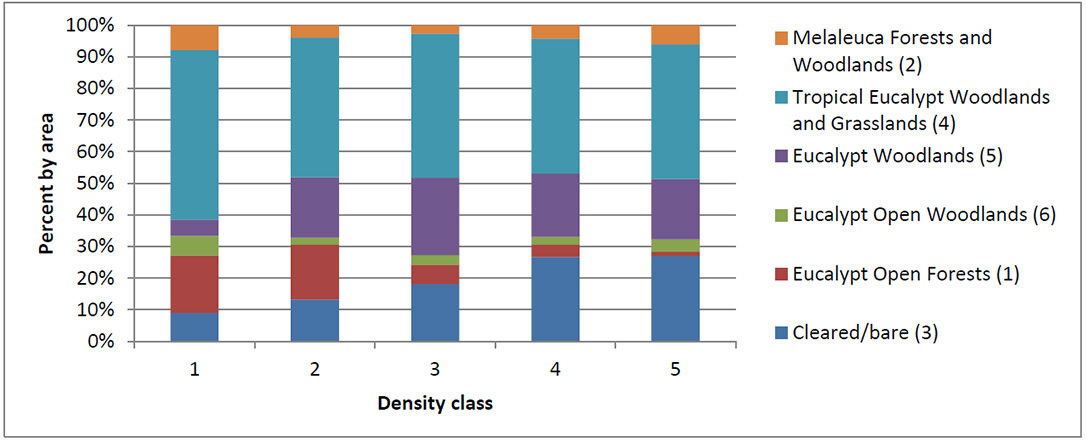
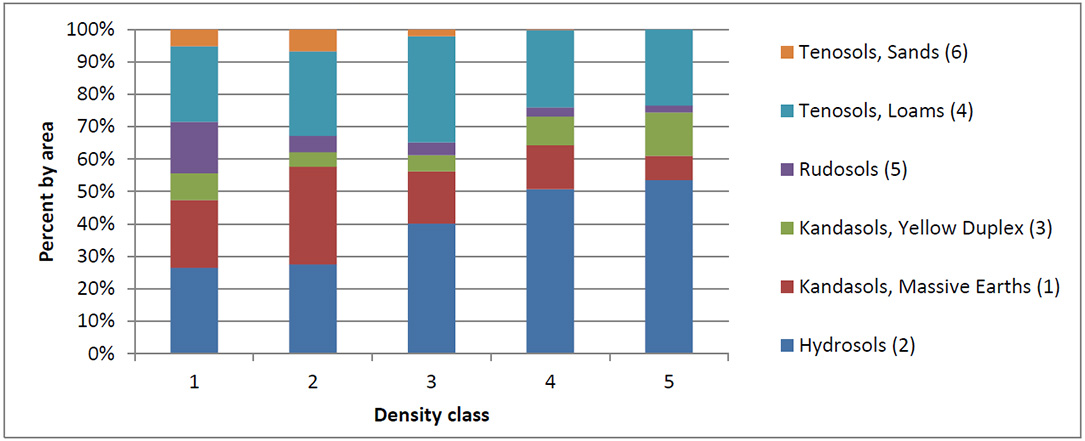
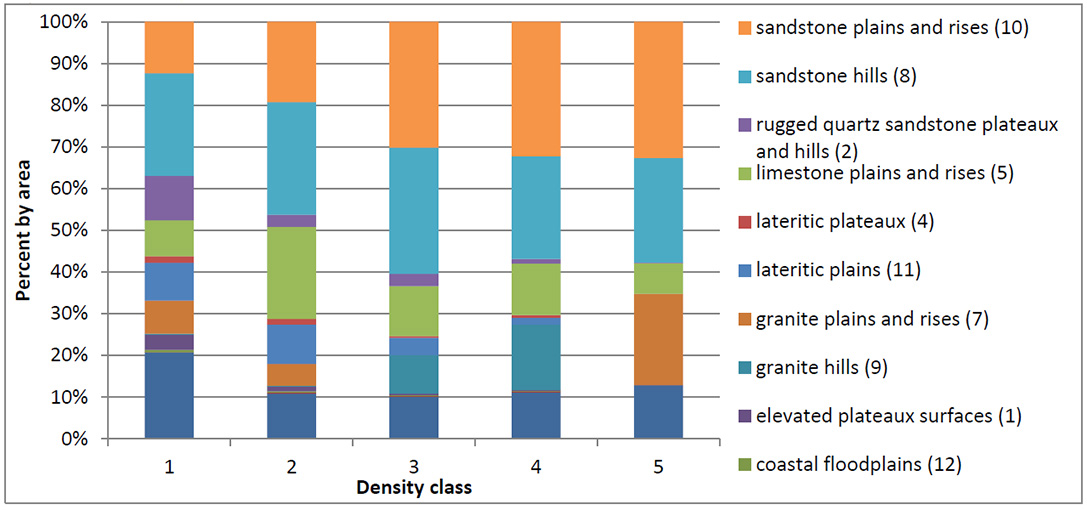
Density of gamba grass is positively correlated with cleared land, eucalypt woodlands (Fig. A2), hydrosols (Fig. A3), sandstone and granite land systems (Fig. A4).
Fig. A2. Gamba grass survey sample response to vegetation type.
Fig. A3. Gamba grass survey sample response to soil type.
Fig. A4. Gamba grass survey sample response to land system type.
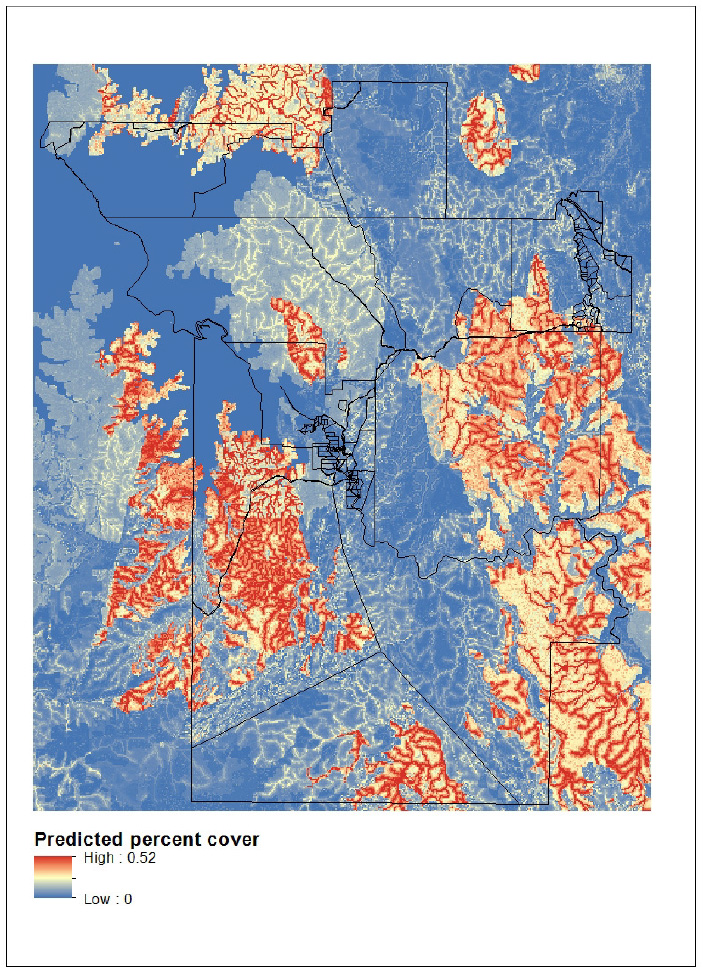
We used a boosted regression tree model to model gamba grass suitability. We converted density classes into a continuous variable by using the average cover for each class (1 = 0, 2 = 0.01, 3 = 0.10, 4 = 0.5 , 5 = 1). We used a 5,000 point sub-sample of our total survey data resampled from the data to remove oversampling of some of the predictors so that the sub-sample reflected the distribution of predictors across the study region. We masked out the 'coastal floodplains' land system as we did not have adequate sampling for this land system and experiments show that this is unsuitable for gamba grass due to annual flooding. We ran the boosted regression tree in R using all predictors at a learning rate of 0.01, and a tree complexity of 5 and ran for 2500 trees. The model explained 40% of deviance and had a cross validation correlation of 0.5451. The model had a poor predictive power for high cover classes, with predicted percentage cover ranged from 0 to 0.52. This is likely due to a lack of fine scale predictors that varied between density class 4 and 5 and a lower percentage of sample sites with density class 5. The predicted percent cover is provided in Fig. A5.
Fig. A5. Predicted percent cover for gamba grass across the study region.
The response functions are provided in Fig. A6 and A7 and reflect the data trends found in Figs. A2–A4.
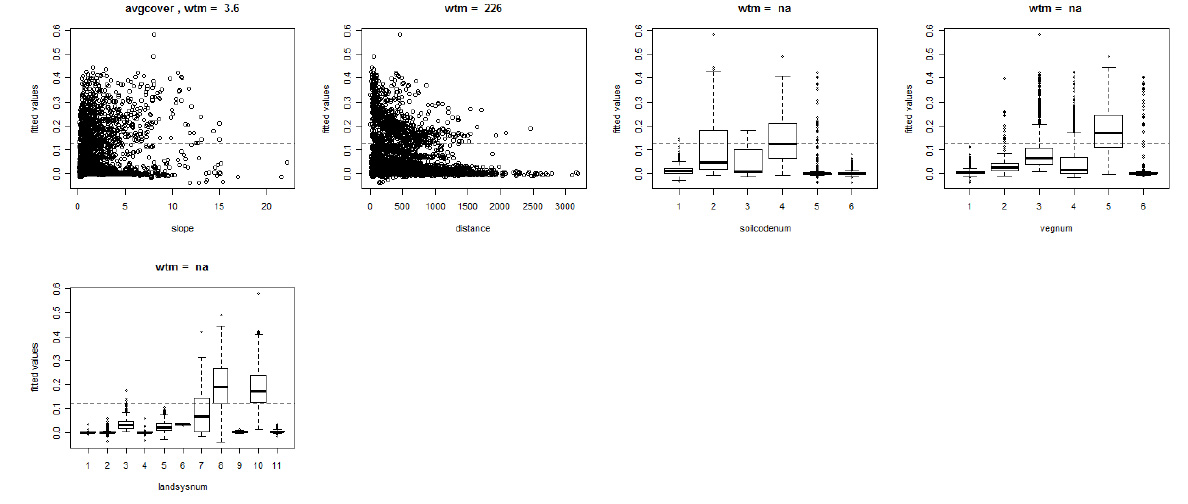
Fig. A6. Predictor response.
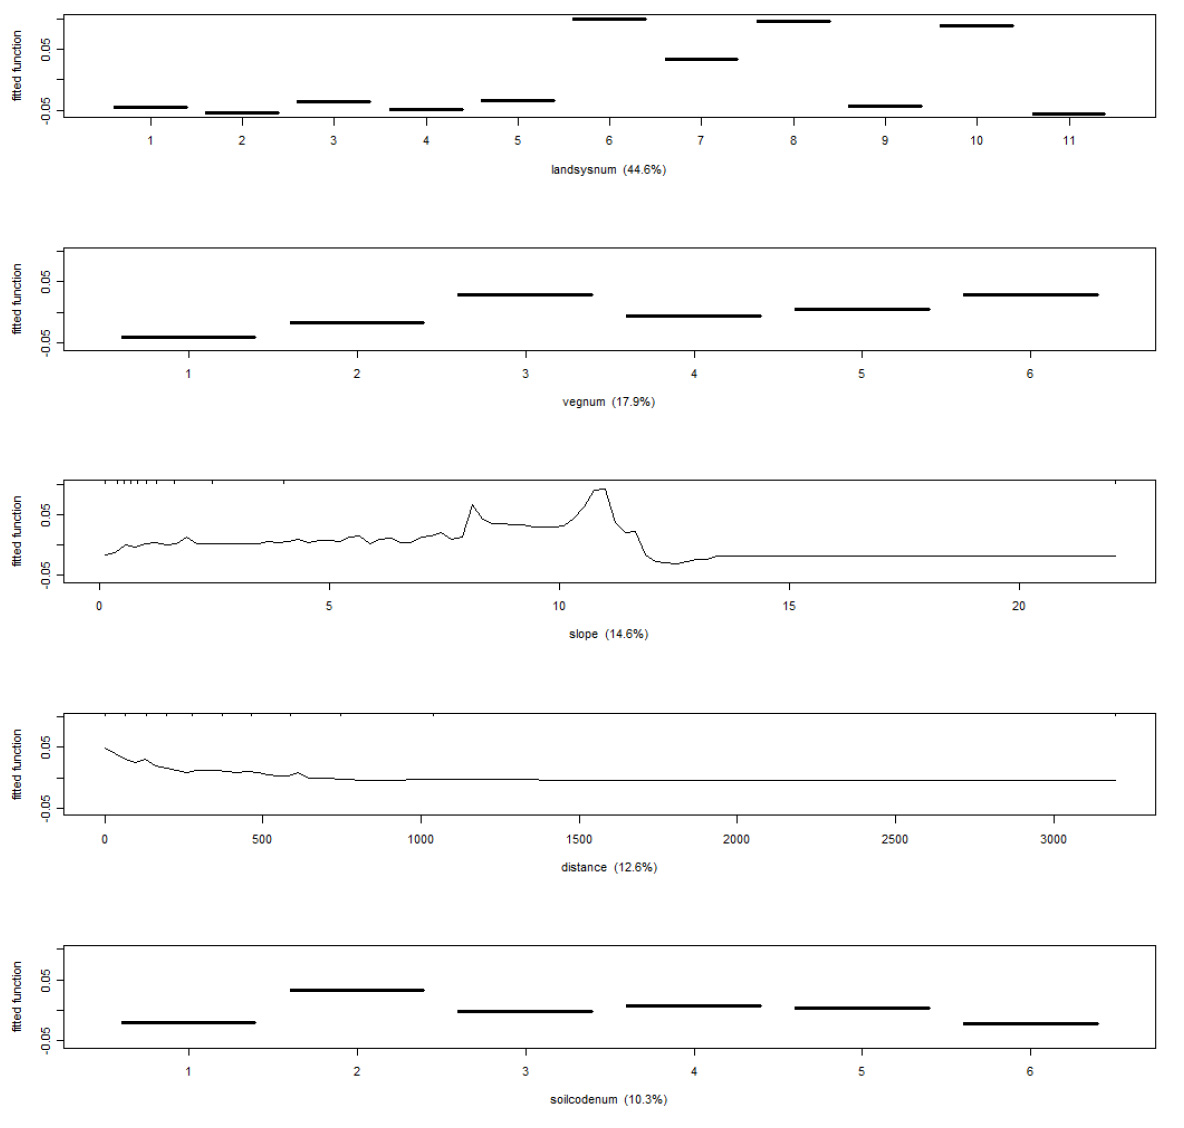
Fig. A7. Response curves