Ecological Archives A025-064-A6
Michael Dorman, Tal Svoray, Avi Perevolotsky, Yitzhak Moshe, and Dimitrios Sarris. 2015. What determines tree mortality in dry environments? A multiperspective approach. Ecological Applications 25:10541071. http://dx.doi.org/10.1890/14-0698.1
Appendix F. Additional details regarding cluster analysis of NDVI spatiotemporal data.
Table F1. Biotic and physical characteristics in four zones within the forest (Fig. 7), obtained by spatiotemporal clustering of NDVI data. Values for age, density, and mortality are average ± one standard error.
Cluster |
Proportion (%) |
Age (in 2012) |
Density (trees/ha) |
Southern aspect (%) |
Deeper soil (%) |
Mortality (%) |
1 |
24 |
40.6±0.7 |
329.6±11.7 |
47.3 |
16.1 |
12.0±2.0 |
2 |
36 |
41.5±0.3 |
372.7±10.2 |
61.5 |
5.3 |
3.2±0.7 |
3 |
32 |
42.0±0.8 |
283.2±9.5 |
51.0 |
2.6 |
2.7±0.7 |
4 |
8 |
29.9±1.3 |
420.5±29.7 |
51.4 |
29.7 |
1.5±0.6 |
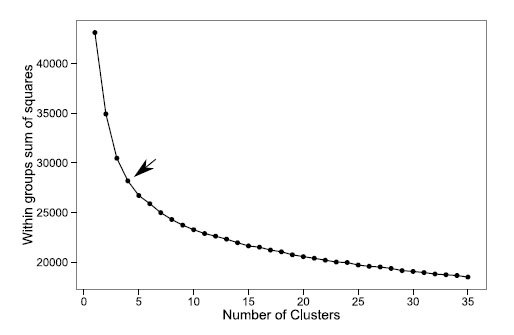
Fig. F1. Within groups sum of squares as function of number of clusters, in K-means clustering of spatiotemporal NDVI data. The arrow marks the visually determined optimal number of clusters (four), located where the curve starts to bend (i.e., where increasing the number of clusters does not substantially reduce within-cluster variability).