Ecological Archives A025-064-A3
Michael Dorman, Tal Svoray, Avi Perevolotsky, Yitzhak Moshe, and Dimitrios Sarris. 2015. What determines tree mortality in dry environments? A multiperspective approach. Ecological Applications 25:10541071. http://dx.doi.org/10.1890/14-0698.1
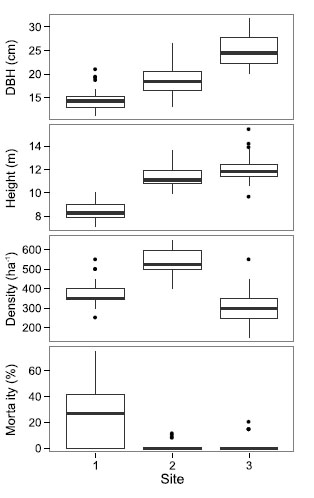
Appendix C. Structural characteristics of the three sites where dendrochronological sampling took place.
Fig. C1. Trees Diameter at Breast Height (DBH), height, density, and mortality in the three sites where dendrochronological sampling took place (n = 30 in each site). Boxplots show the distribution of observed values among either the sampled trees (DBH, height) or those in the 8-m-radius circles around them (density, mortality). Density measurements express both living and standing dead trees, while mortality measurements express percentage of the dead trees. The upper and lower "hinges" correspond to the 25% and 75% quartiles. The upper whiskers extend from the hinge to the highest value that is within 1.5 of the 25–75% inter-quartile range. Data beyond the end of the whiskers are outliers and plotted as points.