Ecological Archives A025-064-A1
Michael Dorman, Tal Svoray, Avi Perevolotsky, Yitzhak Moshe, and Dimitrios Sarris. 2015. What determines tree mortality in dry environments? A multiperspective approach. Ecological Applications 25:10541071. http://dx.doi.org/10.1890/14-0698.1
Appendix A. Data sources and final products for mapping tree mortality and environmental conditions in Lahav and Dvira forests.
Table A1. Images identification code, acquisition date, number of control points, and Root Mean Square Error (RMSE) in georeferencing, for 10 historical aerial photographs used to map cultivated areas in 1945. Rows in the table are ordered according to images order in space, from left to right (i.e., west to east) and then top to bottom (i.e., north to south; see Fig. A4).
Forest |
Image ID |
Date |
Control points |
RMSE (m) |
Dvira |
ps21-5140 |
28.1.1945 |
25 |
3.70 |
|
ps13-6032 |
5.1.1945 |
21 |
3.94 |
|
ps13-6033 |
5.1.1945 |
21 |
4.00 |
Lahav |
ps13-5154 |
5.1.1945 |
22 |
4.58 |
|
ps13-5152 |
5.1.1945 |
21 |
4.15 |
|
ps29-6071 |
14.3.1945 |
25 |
4.54 |
|
ps29-6069 |
14.3.1945 |
27 |
2.43 |
|
ps13-5137 |
5.1.1945 |
22 |
4.41 |
|
ps13-5138 |
5.1.1945 |
23 |
3.08 |
|
ps13-5139 |
5.1.1945 |
24 |
4.36 |
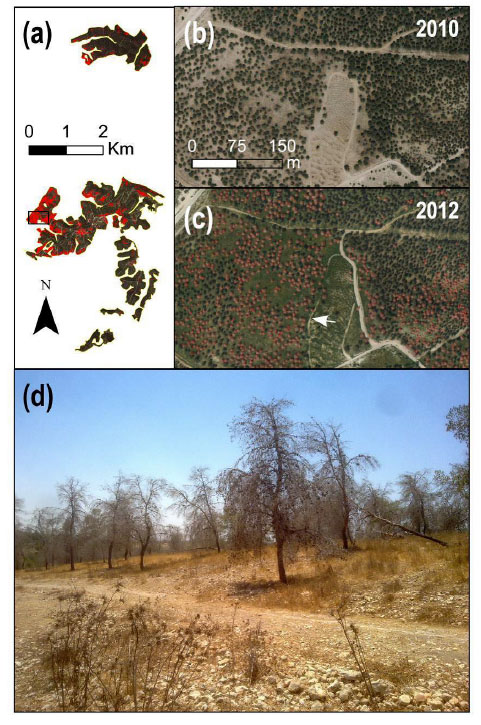
Fig. A1. An example of a high-mortality location in Lahav forest is marked by a black rectangle in (a). Aerial photographs of that area from summer 2010 and winter 2012 are shown in (b) and (c), respectively. Dead trees (distinguishable by their gray/reddish color on the 2012 image) were marked by red circles in (a) and (c). A ground photograph of the location marked by a white arrow in (c) is shown in (d). (Photo: Michael Dorman, summer 2012).
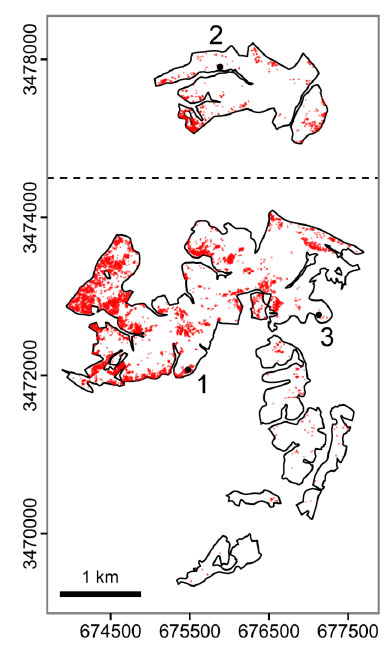
Fig. A2. Dead trees locations in Lahav and Dvira forests. Each dead tree identified on the aerial photograph (see Fig. A1) is marked by a red dot. Sites where dendrochronological sampling took place are marked by numbered (1–3) black dots. Universal Transverse Mercator (UTM) zone 36 N coordinates (m) are shown on the axes.
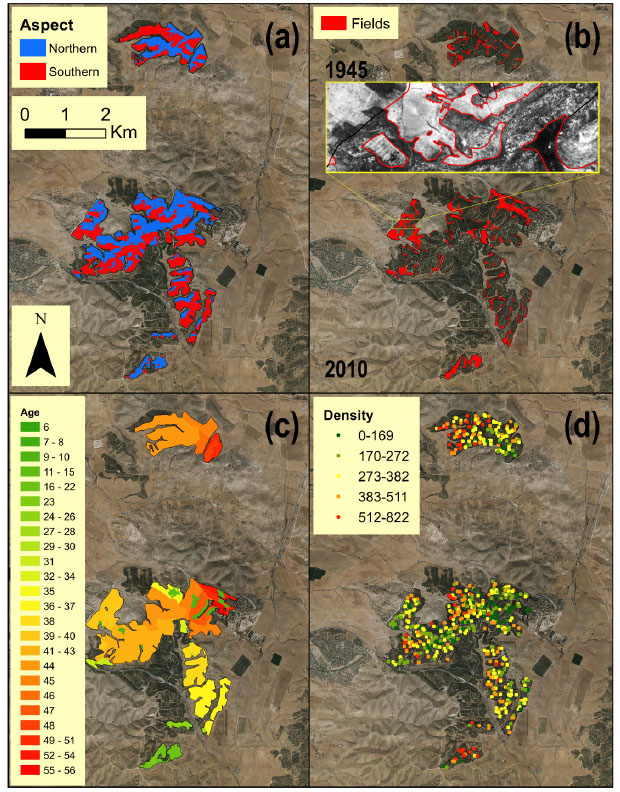
Fig. A3. Environmental conditions in Lahav and Dvira forests: (a) topographic aspect, (b) previously cultivated areas, (c) forest age (in 2012), (d) trees density (trees/ha). The background is an aerial photograph from 2010.
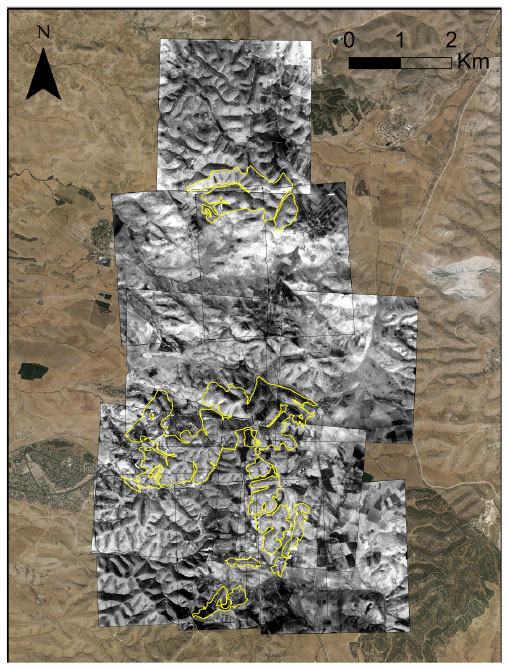
Fig. A4. A mosaic of 10 aerial photographs taken in 1945 (Table A1) used to delineate previously cultivated areas (Fig. A3). The background is an aerial photograph from 2010. The area that is presently (2012) covered by a P. halepensis planted forest is marked in yellow. Note that no tree cover is visible in 1945, since the first plantings were done in 1956; beforehand most of the area has been either agriculturally cultivated (where soil depth was sufficient) or grazed.