Ecological Archives A025-063-A1
Jonathan Storkey, Thomas Döring, John Baddeley, Rosemary Collins, Stephen Roderick, Hannah Jones, and Christine Watson. 2015. Engineering a plant community to deliver multiple ecosystem services. Ecological Applications 25:10341043. http://dx.doi.org/10.1890/14-1605.1
Appendix A. Biological and agronomic characteristics of candidate legume species used in selection of species for inclusion in field experiments and output of plant competition model for all species mix at Rothamsted.
Table A1. Biological and agronomic data for candidate legumes analyzed for selection of short list of functionally contrasting species for inclusion in the field experiments (indicated in bold, Lathyrus pratensis and Vicia sativa grew poorly at several sites and could not be included in the analysis). Biological data were obtained from the UK Ecological Flora database 7, agronomic data (indicated with an asterisk) were compiled from consulting with a panel of growers and seed producers to derive categories of relative agronomic performance.
Species |
Maximum height (cm) |
Flowering time (month) |
Seed size (mg) |
Rooting depth* |
Productivity* |
Establishment* |
Competitive ability* |
Anthyllis vulneraria (L.) |
60 |
6 |
3.1 |
4 |
1 |
1 |
1 |
Lathyrus Pratensis (L.) |
120 |
5 |
12.4 |
6 |
4 |
5 |
1 |
Lotus corniculatus (L.) |
35 |
5 |
1.2 |
3 |
1 |
1 |
3 |
Lotus pedunculatus (Cav.) |
60 |
6 |
1 |
3 |
3 |
2 |
3 |
Lupinus albus (L.) |
120 |
6 |
297.5 |
5 |
4 |
5 |
1 |
Lupinus augustifolius (L.) |
120 |
6 |
168 |
5 |
4 |
5 |
1 |
Lupinus luteus (L.) |
60 |
6 |
129.6 |
5 |
4 |
5 |
1 |
Medicago lupulina (L.) |
60 |
4 |
1.6 |
3 |
3 |
5 |
3 |
Medicago sativa (L.) |
90 |
6 |
2.4 |
5 |
5 |
1 |
2 |
Melilotus albus (Medick) |
150 |
7 |
2.3 |
6 |
5 |
5 |
3 |
Onobrychis viciifolia (Scop.) |
60 |
6 |
19.2 |
4 |
5 |
1 |
2 |
Trifolium alexandrinum (L.) |
45 |
5 |
2.8 |
4 |
3 |
5 |
1 |
Trifolium hybridum (L.) |
40 |
6 |
0.7 |
4 |
4 |
1 |
2 |
Trifolium incarnatum (L.) |
50 |
5 |
3.1 |
3 |
3 |
1 |
1 |
Trifolium pratense (L.) |
100 |
5 |
1.8 |
5 |
5 |
1 |
3 |
Trifolium repens (L.) |
50 |
6 |
0.5 |
3 |
3 |
1 |
3 |
Trifolium resupinatum (L.) |
50 |
5 |
0.8 |
4 |
3 |
1 |
1 |
Trifolium subteranneum (L.) |
20 |
5 |
6.7 |
5 |
5 |
4 |
3 |
Trigonella foenum graecum (L.) |
20 |
5 |
11.9 |
3 |
5 |
5 |
3 |
Vicia hirsute (L. Gray) |
30 |
5 |
4.9 |
4 |
1 |
1 |
1 |
Vicia lathyroides (L.) |
20 |
5 |
2 |
4 |
5 |
5 |
3 |
Vicia sativa (L.) |
120 |
6 |
41.1 |
4 |
5 |
1 |
3 |
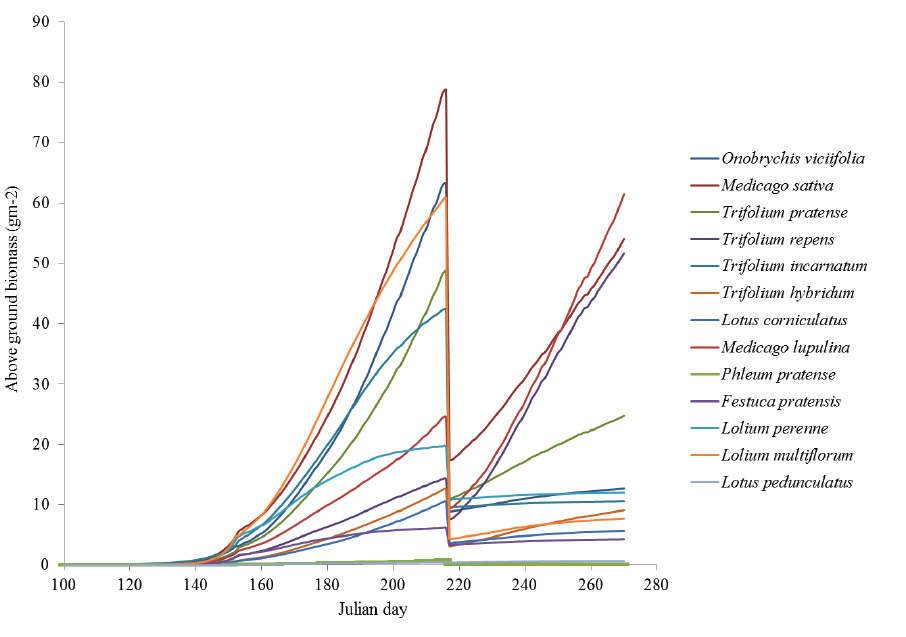
Fig. A1. Output of simulation model of legume growth and competition for the ASM plots, including 10 legume species and four grasses. The model was initialised using the seed rates used in the mix and percentage germination data from the monoculture plots at Rothamsted. Weather data was obtained from a meteorological station local to the site for the period from sowing to the second cut (April–October 2009).
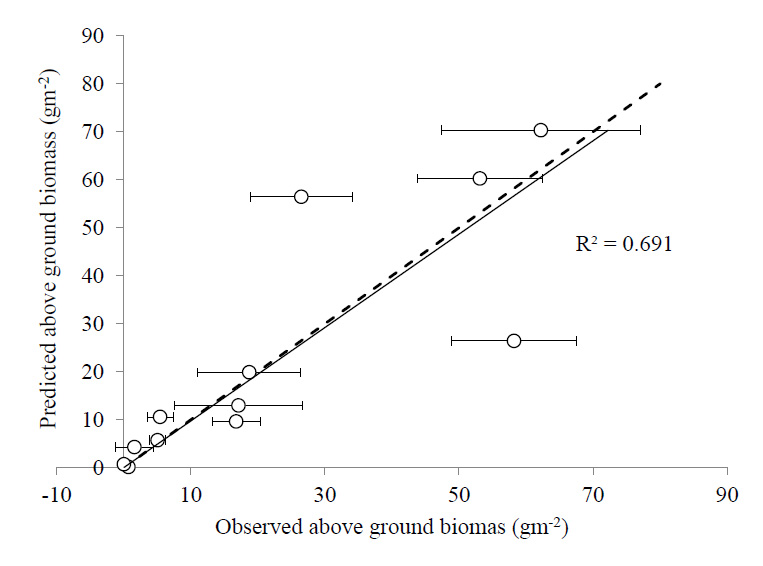
Fig. A2. The ASM plots were sampled on the 05/10/2009 at Rothamsted and separated into component species before measuring above ground dry mass. Open circle = average above ground biomass of individual species in ASM from six replicate plots (biomass of L.multiflorum and L.perenne has been combined), error bars = standard errors of the means. ---- x=y. Although the model performed well for most species, the competitive balance between Trifolium repens and Trifolium pratense was predicted to favor T.repens to a greater extent than was observed.