Ecological Archives A025-061-A1
David Peel, Mark Bravington, Natalie Kelly, and Michael C. Double. 2015. Designing an effective markrecapture study of Antarctic blue whales. Ecological Applications 25:10031015. http://dx.doi.org/10.1890/14-1169.1
Appendix A. Markrecapture sample size prediction.
To provide an indicative mark–recapture survey sample size we used the R package WATS (Whale Acoustic Tracking Simulation) available from:
sourceforge.net/projects/watspackage/
and described in (Peel et al. 2014). The package simulates acoustic-assisted tracking of whales using an individual-based simulation framework. Specifically, for a given whale density, whales were randomly placed in a survey region and an acoustic-assisted mark–recapture survey was simulated based on search protocols/rules and assumed acoustic properties.
When applying the simulation to model a future Antarctic survey many of the parameters were unknown. So information was used from a pilot study (Double et al. 2013) as well as information from previous blue whale studies (see Table 2 in Peel et al. 2014).
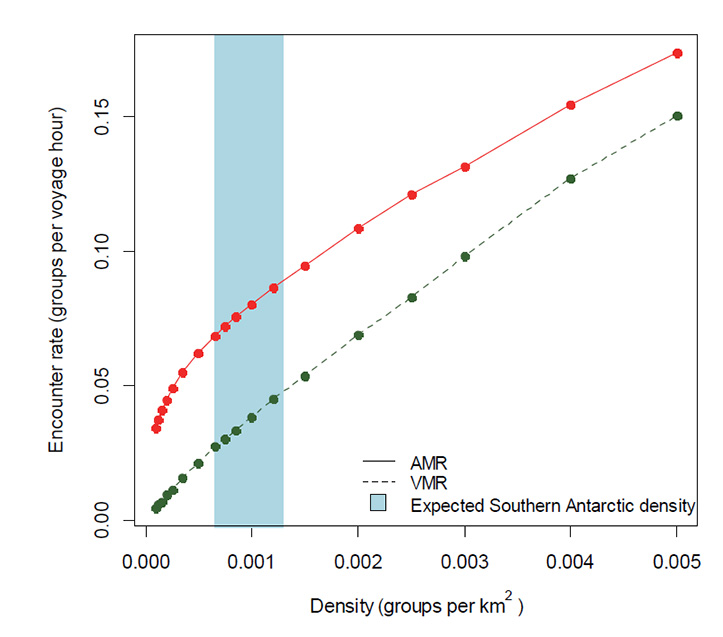
The simulation was run at various assumed population densities (See Fig. A2) with each point based on 1000 replicated populations/surveys. The reported encounter rates are in terms of groups per hour, over the full survey period (i.e., this includes night and bad weather). It was found that an acoustic-assisted survey would be expected to produce approximately a 1.7–3.0 fold increase in encounter rate, over a traditional line transect survey, at predicted Antarctic blue whale densities. This gain arises from the increased range of acoustic methods over visual-detection, as well as the benefit from the ability to track overnight and in adverse weather conditions, countered by the reduced on-effort time in mark-recapture due to time spent biopsying animals.
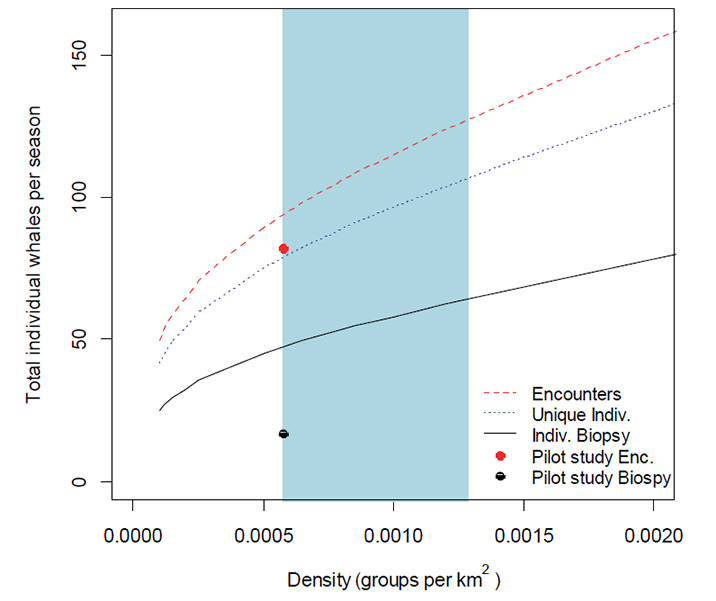
For the mark–recapture variance calculations in the main paper, we interpolated the encounter data (in Fig. A1) to provide an encounter rate for any given whale density and then multiply by adjustments for expected group size, within-season resights, biopsy success rate and voyage length to get sample sizes (Fig. A2). There is some discrepancy between the simulation predicted encounter rates (particularly the number of biopsies) and the rates seen in the pilot study. This is discussed further in the discussion of the main paper.
Fig. A1. Simulated whale group encounter rates for a given whale density.
Fig. A2. Simulated total sample size for 37.5 days of effort for a given whale density.
Literature cited
Double, M. C., J. Barlow, B. S. Miller, P. Olson, V. Andrews-Goff, R. Leaper, P. Ensor, N. Kelly, V. Wadley, M. Lindsay, D. Peel, S. Calderan, K. Collins, M. Davidson, C. Deacon, D. C. O. Donnelly, K. Owen, M. Rekdahl, N. Schmitt, and N. Gales. 2013. Cruise report of the 2013 Antarctic blue whale voyage of the Southern Ocean Research Partnership SC/65a/SH21, 1–16.
Peel, D., B. S. Miller, N. Kelly, S. Dawson, E. Slooten, and M. C. Double. 2014. A simulation study of acoustic-assisted tracking of whales for mark-recapture surveys PloS one, 9:e95602.