Ecological Archives A025-056-A1
A. Justin Nowakowski, Marylin Veiman-Echeverria, David J. Kurz, and Maureen A. Donnelly. 2015. Evaluating connectivity for tropical amphibians using empirically derived resistance surfaces. Ecological Applications 25:928942. http://dx.doi.org/10.1890/14-0833.1
Appendix A. Tables containing (1) cost values used to develop resistance surfaces, (2) additional results from microclimatic exposure experiments, and (3) statistical results of choice experiments. Figures showing (1) travel times from substrate resistance experiments with naïve observers, (2) the relationship between percentage overlap of species corridors and forest cover, and (3) representations of the three connectivity models.
Table A1. Cost values derived from experiments and survey data using response ratios.
Species |
Land use |
Source of cost values |
|
|
|
|
||
Oophaga pumilio |
Abundance |
Water loss |
Survival |
Substrate |
Predation |
Choice |
||
|
Banana |
41 |
2.63 |
12.5 |
0.95 |
12.12 |
1.41 |
|
|
Palmito |
41 |
2.63 |
12.5 |
0.95 |
12.12 |
1.41 |
|
|
Pineapple |
9.11 |
3.4 |
24.24 |
1.59 |
6.06 |
1.15 |
|
|
Pasture |
9.11 |
3.4 |
24.24 |
1.59 |
6.06 |
1.15 |
|
|
Water |
17.04 |
2.34 |
12.58 |
1.18 |
6.39 |
1.19 |
|
|
Plantation |
5.06 |
1.82 |
6.75 |
0.98 |
3.53 |
1.08 |
|
|
Forest |
1 |
1 |
1 |
1 |
1 |
1 |
|
Craugasto bransfordii |
|
|
|
|
|
|
||
|
Banana |
3.59 |
3.99 |
25.93 |
1.01 |
0.86 |
0.94 |
|
|
Palmito |
3.59 |
3.99 |
25.93 |
1.01 |
0.86 |
0.94 |
|
|
Pineapple |
790 |
3.72 |
33.33 |
1.76 |
0.86 |
0.67 |
|
|
Pasture |
790 |
3.72 |
33.33 |
1.76 |
0.86 |
0.67 |
|
|
Water |
264.86 |
2.9 |
20.09 |
1.26 |
0.91 |
0.87 |
|
|
Plantation |
2.3 |
2.36 |
13.47 |
1.01 |
0.93 |
0.97 |
|
|
Forest |
1 |
1 |
1 |
1 |
1 |
1 |
|
Table A2. GLMM results for analyses of water loss during microclimatic exposure experiments after dropping ambient temperature from the model.
|
Estimate |
Std. Error |
z value |
Pr(>|z|) |
(Intercept) |
-0.13599 |
1.85292 |
-0.073 |
0.9415 |
Sp[T.Op] |
0.02632 |
0.37492 |
0.07 |
0.9440 |
SVL |
-0.07856 |
0.08245 |
-0.953 |
0.3407 |
Sex[T.M] |
-0.24917 |
0.41801 |
-0.596 |
0.5511 |
LC.type[T.Palmito] |
0.90461 |
0.48664 |
1.859 |
0.0630 |
LC.type[T.Pasture] |
0.93087 |
0.47606 |
1.955 |
0.0505 |
Table A3. Results of binomial tests comparing number of individuals found on each substrate at the end of trial as a measure of substrate choice.
Species |
Comparison |
Forest (inds) |
Alternative (inds) |
No Choice |
P |
O. pumilio |
Forest-Palmito |
24 |
17 |
4 |
0.5854 |
O. pumilio |
Forest-Pasture |
23 |
20 |
2 |
0.5349 |
C. bransfrodii |
Forest-Palmito |
17 |
18 |
9 |
0.4857 |
C. bransfrodii |
Forest-Pasture |
14 |
21 |
10 |
0.4000 |
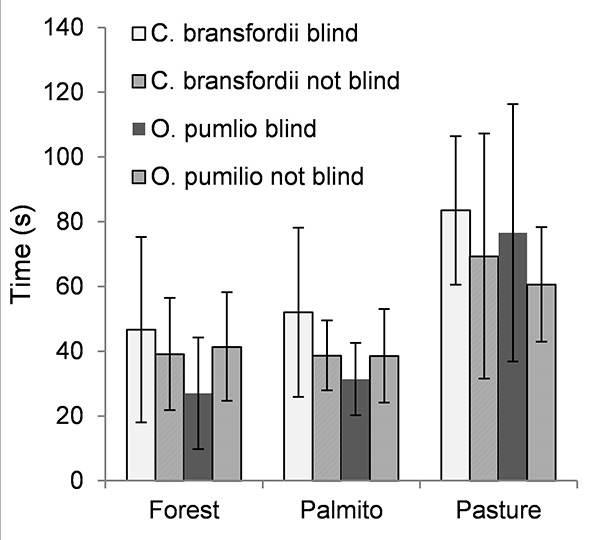
Fig. A1. Mean travel times for "blind" trials using observers unfamiliar with the study objectives (n = 30) and trials conducted by the primary observers (n = 171). Error bars represent standard deviations.
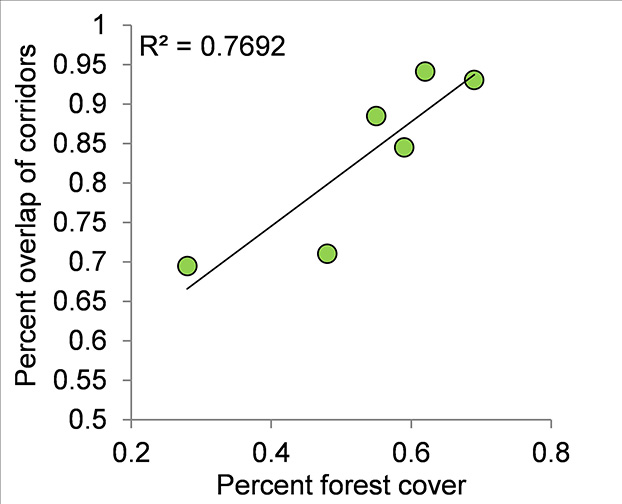
Fig. A2. Relationship between percent overlap of predicted movement corridors for each species and percent forest cover in each of the six focal landscapes.
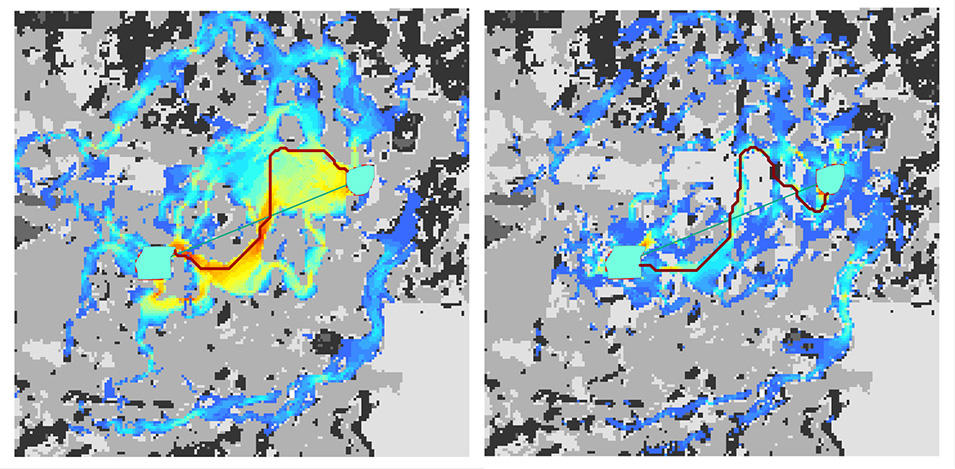
Fig. A3. One replicate 625 km² landscape in Sarapiquí, Costa Rica. The dominant land cover types are palmito (light gray), pastures (medium gray), and forest (black). Three measures of connectivity are shown between two forest patches (light blue polygons) for C. bransfordii (left) and O. pumilio (right). Euclidean distances are represented by green lines connecting patches. Least-cost paths based on abundance-derived resistance surfaces are shown in red. Areas of high current density from Circuitscape models are shown in blue, yellow and red, with warm colors associated with highest current densities (analogous to net movement probabilities). Note that multiple pathways highlighted by current maps as opposed to single pathways represented by least-cost paths and Euclidean distances.