Ecological Archives A025-052-A1
Zhijian Zhang, Hongyi Li, Jiao Hu, Xia Li, Qiang He, Guangming Tian, Hang Wang, Shunyao Wang, and Bei Wang. 2015. Do microorganism stoichiometric alterations affect carbon sequestration in paddy soil subjected to phosphorus input? Ecological Applications 25:866879. http://dx.doi.org/10.1890/14-0189.1
Appendix A. Supplementary information on field study site and experimental design; statistic analysis on soil chemistry, microbial biomass, and enzyme activity in response to P application treatments, block and their interactions; hierarchical cluster analysis of the bacterial distribution of the 150 most abundant families in soil samples among the four treatments.
Materials and methods
Study site and experimental design. A plot experiment on P management for paddy fields was established in April 2005 at the YuHang County Agricultural Research Station demonstration park (30°18'51.84"N, 119°54'13.37"E) in ZheJiang, China. The soil before experimental plot construction was composed of 3% sand, 47% silt, and 50% clay in the top 150 mm, while contents of soil total P, total C, and total N were 13.7, 2087, and 148 mmol/kg, respectively. The construction of the field experimental plots, including specific designs on plot ridges, trenches, berms, and inlets/outlets was describled previously (Zhang et al. 2007). Briefly, twelve 4 m × 5 m plots were constructed in two parallel rows in 2005. In order to keep each of these plots hydrologically isolated, a high-density polyethylene impermeable membrane of 0.75 mm (thickness) × 105 cm depth was first inserted between two neighboring plots and then 12 cm (width) × 105 cm (depth) concrete-brick walls were attached to both sides of the membrane. The experiment was conducted using a completely randomized block design with three replicates for each treatment. All plots also received 170 kg·N·ha-1 (urea) and 50 kg·K·ha-1 (KCl) each year.
Table A1. Results of repeated ANOVA showing F values for soil chemistry, microbial biomass, and enzyme activity in response to P application treatments (P-0, P-30, P-60, and P-90), blocks, and their interactions across different sampling dates in a paddy field ecosystem. Significant F values (p < 0.05) are in bold.
Parameter |
Treatment |
Date |
Block |
Treatment × Date |
Treatment × Block |
|
C-related |
TOC |
19.9 |
31.1 |
0.525 |
0.844 |
0.959 |
|
LOC |
51.5 |
90.0 |
1.07 |
3.93 |
1.16 |
|
MBC |
63.1 |
84.6 |
2.78 |
2.98 |
0.81 |
|
BG |
114 |
184 |
3.17 |
7.56 |
0.47 |
P-related |
TP |
226 |
159 |
2.97 |
1.98 |
0.646 |
|
Olsen-P |
437 |
40.2 |
1.56 |
6.61 |
0.897 |
|
MBP |
536 |
290 |
10.5 |
2.57 |
0.88 |
|
AP |
273 |
406 |
0.164 |
5.05 |
0.823 |
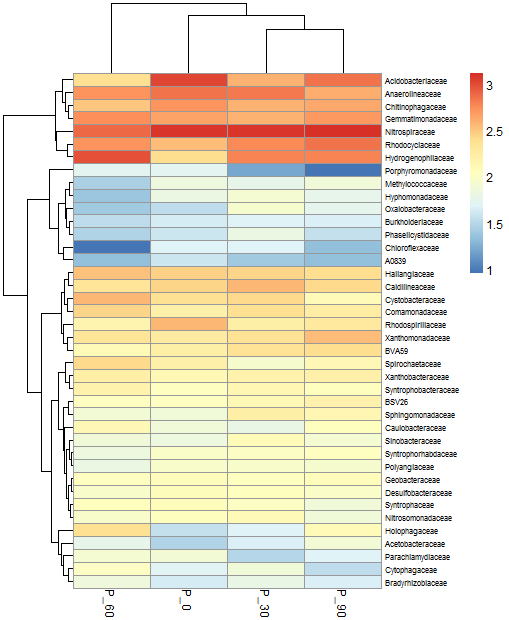
Fig. A1. Hierarchical cluster analysis of the bacterial distribution of the 150 most abundant families in soil samples among the four treatments, presented as a double dendrogram. The bacterial phylogenetic tree was calculated using the neighbor-joining method and the relationship among samples was determined by Bray-Curtis distance and the complete clustering method. The heatmap plot depicts the relative percentage of each bacterial family (variables clustering on the vertical axis) within each sample (horizontal axis clustering). The relative values for each bacterial family are indicated by color intensity according to the legend indicated at the top right corner.
Literature cited
Anderson, T.-H., and K. Domsch. 1990. Application of eco-physiological quotients ( qCO2 and qD) on microbial biomasses from soils of different cropping histories. Soil biology and Biochemistry 22:251-255.