Ecological Archives A025-050-A5
Robert T. Fahey, Alexander T. Fotis, and Kerry D. Woods. 2015. Quantifying canopy complexity and effects on productivity and resilience in late-successional hemlockhardwood forests. Ecological Applications 25:834847. http://dx.doi.org/10.1890/14-1012.1
Appendix E. Comparison of stand characteristics and structural complexity metrics among species composition groups.
Methods
Plots were previously classified into groups based on species composition, site characteristics, and proximity (Table 1; Woods 2000a, b). Measures of canopy structure were compared among species groups (delineated in Woods 2000a, b) with ANOVA using PROC GLM in SAS v. 9.2. Individual group comparisons were made using the Tukey-Kramer adjustment for multiple comparisons.
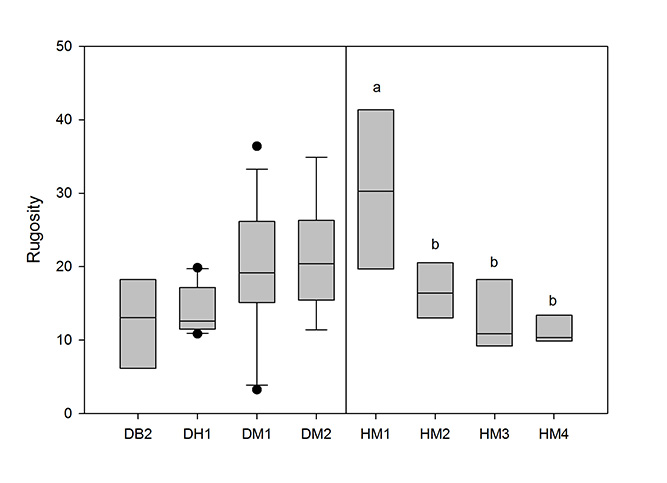
Mean rugosity varied significantly among species groups at both sites (Hurons – F3,15 = 7.19, p = 0.003; Dukes – F3,39 = 3.58, p = 0.022; Table D2). Based on pairwise comparisons, only the HM1 group (very high sugar maple dominance; Woods 2000a) differed from other species groups after accounting for multiple comparisons (all p < 0.05; Table D2). However, the maple dominated groups at Dukes had somewhat higher mean rugosity that was marginally significantly different from the beech (Fagus grandifolia) and hemlock dominated groups (DB1, DB2, DH1; all comparisons p > 0.06 < 0.08). Productivity was also relatively similar among species groups, although the maple dominated plots at Huron (HM1) had especially high productivity (Table E1).
Literature cited
Woods, K. D. 2000a. Dynamics in late-successional hemlock-hardwood forests over three decades. Ecology 81:110–126.
Woods, K. D. 2000b. Long-term change and spatial pattern in a late-successional hemlock-northern hardwood forest. Journal of Ecology 88:267–282
Table E1. Summary of stand characteristics by species groups with standard deviations in parentheses.
Group/ |
Composition |
Plots |
Rugosity (m) |
Basal area (m2 ha-1) |
Density (stems ha-1) |
Storm basal |
Aboveground biomass |
Biomass increment |
ANPP |
ANPP Resilience |
DB1 |
Mixed (Birch) |
15 |
20.9 (5.0) |
51.1 (10.1) |
1079.2 (167.9) |
2.4 (4.0) |
389.5 (73.3) |
-10.8 (54.0) |
1.9 (0.7) |
0.78 (0.27) |
DB2 |
Mixed (Beech) |
16 |
12.2 (6.2) |
42.9 (13.0) |
1132.8 (327.6) |
18.8 (15.5) |
327.3 (103.3) |
-10.5 (48.3) |
2.9 (0.6) |
1.08 (0.26) |
DH1 |
Hemlock |
18 |
14.2 (3.2) |
48.1 (12.0) |
1206.3 (317.1) |
5.9 (8.6) |
318.0 (68.7) |
3.8 (24.1) |
1.9 (0.4) |
0.98 (0.24) |
DH2 |
Hemlock |
10 |
- |
59.6 (21.6) |
1015.0 (246.6) |
5.7 (12.5) |
425.2 (165.8) |
3.1 (23.6) |
1.8 (0.6) |
0.74 (0.24) |
DM1 |
Maple |
36 |
19.6 (9.2) |
36.4 (10.6) |
1053.5 (245.2) |
17.0 (19.7) |
319.6 (108.0) |
-0.5 (33.8) |
2.5 (0.9) |
0.94 (0.40) |
DM2 |
Maple |
25 |
21.3 (7.5) |
40.0 (8.0) |
965.5 (236.7) |
13.8 (14.6) |
367.5 (85.4) |
4.0 (32.4) |
2.2 (0.8) |
0.83 (0.33) |
UN |
None |
7 |
13.3 (-) |
44.2 (14.5) |
1069.6 (233.8) |
14.1 (13.3) |
336.8 (113.4) |
8.3 (25.4) |
2.5 (1.0) |
1.09 (0.19) |
Dukes |
|
127 |
17.2 (7.4) |
43.6 (13.6) |
1068.7 (263.5) |
12.2 (15.5) |
347.3 (104.3) |
-0.7 (36.1) |
2.3 (0.8) |
0.92 (0.33) |
HM1 |
Maple |
6 |
30.4a (11.3) |
61.7 (6.2) |
618.8 (199.2) |
- |
594.9 (70.5) |
16.8 (21.1) |
3.7 (0.9) |
|
HM2 |
Mixed (Maple) |
9 |
15.8b (4.6) |
68.4 (13.5) |
543.3 (131.9) |
- |
563.5 (104.5) |
-8.0 (51.1) |
3.2 (0.5) |
|
HM3 |
Mixed (Hemlock) |
7 |
13.2b (5.2) |
81.6 (15.1) |
678.6 (178.4) |
- |
605.5 (122.6) |
-8.8 (24.5) |
3.3 (0.6) |
|
HM4 |
Hemlock |
3 |
11.2b (1.9) |
80.9 (9.3) |
883.3 (40.2) |
- |
521.5 (56.5) |
-6.2 (13.4) |
2.4 (0.4) |
|
Huron |
|
25 |
17.5 (9.2) |
72.0 (14.2) |
640.1 (183.3) |
- |
577.8 (97.3) |
-2.1 (35.3) |
3.2 (0.7) |
|
Total |
|
152 |
17.3 (7.9) |
48.3 (17.3) |
998.2 (297.8) |
- |
385.2 (133.9) |
-0.9 (35.9) |
2.4 (0.9) |
|
Table E2. Summary of mean plot-level complexity by species groups with standard deviations in parentheses.
Group |
Composition |
Plots |
Rugosity (m) |
Horizontal canopy variability |
Height max canopy density |
Mean canopy height |
Vertical canopy variability |
Mean canopy top height |
Canopy top rugosity |
Porosity |
DB1 |
Mixed (Birch) |
15 |
20.9 (5.0) |
7.1 (0.3) |
13.8 (0.1) |
11.8 (0.1) |
19.5 (2.5) |
16.7 (0.1) |
7.1 (0.4) |
0.71 (0.02) |
DB2 |
Mixed (Beech) |
16 |
12.2 (6.2) |
3.9 (1.1) |
7.3 (1.5) |
6.0 (1.2) |
7.9 (4.5) |
9.4 (2.1) |
4.7 (1.2) |
0.72 (0.05) |
DH1 |
Hemlock |
18 |
14.2 (3.2) |
5.3 (0.8) |
9.4 (2.2) |
8.0 (1.9) |
10.8 (2.5) |
12.0 (2.1) |
6.0 (0.7) |
0.70 (0.03) |
DM1 |
Maple |
36 |
19.6 (9.2) |
5.9 (2.1) |
9.8 (3.4) |
8.1 (2.9) |
14.1 (7.6) |
12.1 (3.8) |
6.8 (2.1) |
0.72 (0.05) |
DM2 |
Maple |
25 |
21.3 (7.5) |
6.2 (1.3) |
11.4 (2.5) |
9.6 (2.3) |
17.9 (6.2) |
14.8 (3.0) |
6.7 (1.2) |
0.64 (0.24) |
HM1 |
Maple |
6 |
30.4a (11.3) |
8.7 (0.8) |
18.7 (4.2) |
16.4 (3.3) |
27.3 (12.2) |
22.2 (3.8) |
7.8 (1.0) |
0.74 (0.02) |
HM2 |
Mixed (Maple) |
9 |
15.8b (4.6) |
6.1 (1.3) |
13.6 (2.9) |
12.0 (2.7) |
12.6 (4.2) |
16.1 (2.9) |
6.3 (0.9) |
0.73 (0.01) |
HM3 |
Mixed (Hemlock) |
7 |
13.2b (5.2) |
5.4 (2.0) |
15.9 (2.8) |
14.1 (2.9) |
12.3 (4.9) |
18.2 (3.2) |
4.8 (2.2) |
0.68 (0.04) |
HM4 |
Hemlock |
3 |
11.2b (1.9) |
4.6 (0.1) |
15.3 (1.4) |
13.5 (1.2) |
9.9 (1.6) |
17.1 (1.5) |
4.4 (0.6) |
0.67 (0.03) |
Fig. E1. Boxplot showing rugosity values for plots in species groups. Letters indicate significant individual comparisons from ANOVA comparing rugosity among groups.