Ecological Archives A025-049-A1
Emilay Walker, Jacques Rivoirard, Philippe Gaspar, and Nicolas Bez. 2015. From forager tracks to prey distributions: an application to tuna vessel monitoring systems (VMS). Ecological Applications 25:826833. http://dx.doi.org/10.1890/14-0193.1
Appendix A. Additional figures on cokriging results: empirical and fitted variograms, histogram of all the standard errors of the cokriged estimates of the tuna presence, and values of index of presence for two coefficients of intensive search (IS) parameter.
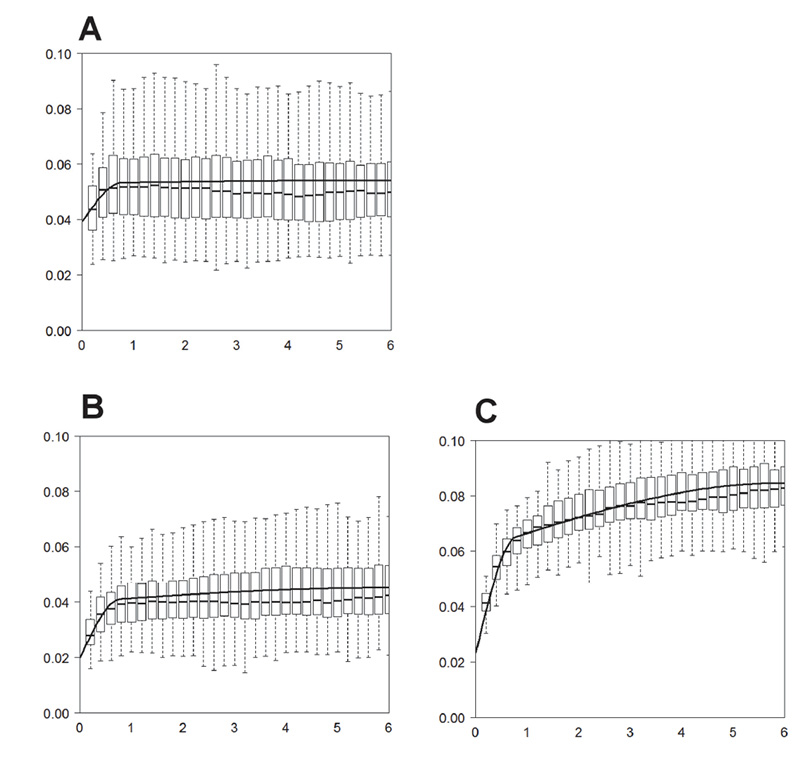
Fig. A1. Empirical monthly variograms (from 2006 to 2010). Boxplots represent the distribution of the 60 monthly variograms. The panels on the diagonal concern the simple variograms for "F" the fishing activity (upper left panel (A)) and "P = F + 0.5IS" the probability of tuna presence (lower right panel (C)).The cross-variogram between F and P is the lower left panel (B). The common coregionalisation model is superimposed to the empirical variogram. Distances (x-axis) are expressed in degrees.
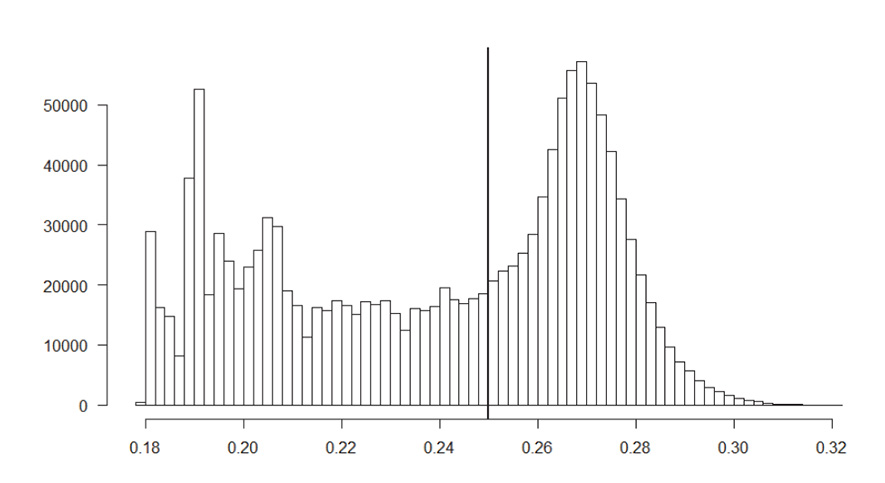
Fig. A2. Histogram of all the standard errors of the cokriged estimates of the tuna presence. The vertical line (0.25) represents the threshold used to mask the parts of the maps that were excluded.
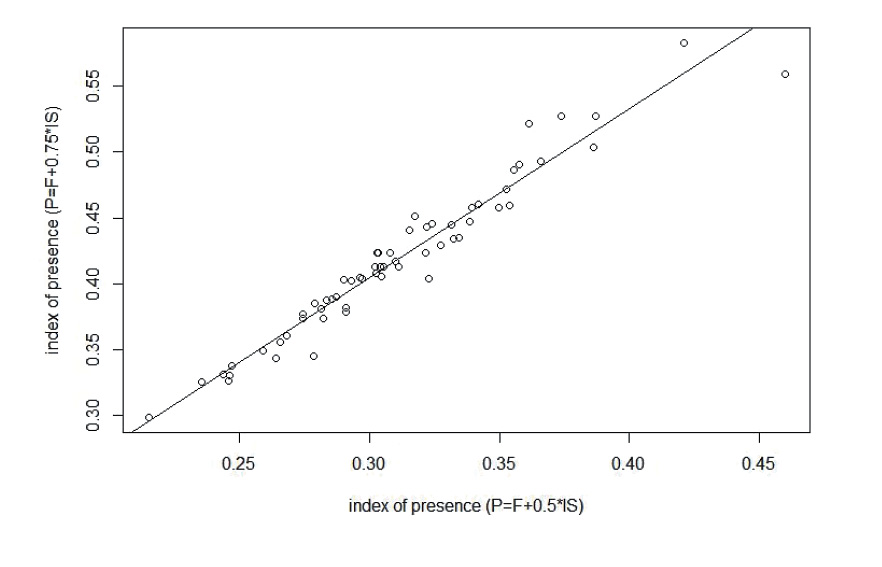
Fig. A3. Values of index of presence for two coefficients of intensive search (IS) parameter: 0.5 and 0.75. The bold line corresponds to the linear regression curve.