Ecological Archives A025-043-A4
Gideon Pisanty and Yael Mandelik. 2015. Profiling crop pollinators: life history traits predict habitat use and crop visitation by Mediterranean wild bees. Ecological Applications 25:742–752. http://dx.doi.org/10.1890/14-0910.1
Appendix D. Supplementary information for the effect of life history traits on agricultural and crop affinities.
Table D1. Parameter estimates for the agricultural and crop affinity models.
Model type |
Model term |
Coefficient |
SE |
|
agricultural affinity |
all species, presence-absence |
intercept |
3.3** |
1.0 |
habitat = interior |
-5.2*** |
1.3 |
||
habitat = edge |
-2.7* |
1.2 |
||
habitat = semi-natural |
0a |
|
||
[nesting=below g.]*[habitat=interior] |
2.4*** |
0.53 |
||
[nesting=above g.]*[habitat=interior] |
0a |
|
||
[nesting=below g.]*[habitat=edge] |
0.62 |
0.38 |
||
[nesting=above g.]*[habitat=edge] |
0a |
|
||
[nesting=below g.]*[habitat=semi-natural] |
-2.7* |
1.1 |
||
[nesting=above g.]*[habitat= semi-natural] |
0a |
|
||
ITD*[habitat=interior] |
-0.060 |
0.24 |
||
ITD*[habitat=edge] |
-0.64** |
0.23 |
||
ITD*[habitat= semi-natural] |
0.23 |
0.34 |
||
dominant species, abundance-based |
intercept |
-0.60 |
0.037 |
|
nesting = below g. |
0.24*** |
0.029 |
||
nesting = above g. |
0a |
|
||
lecty = polylectic |
0.11*** |
0.028 |
||
lecty = oligolectic |
0a |
|
||
crop affinity |
all species, presence-absence |
intercept |
1.6 |
0.21 |
sociality = solitary |
-1.5* |
0.030 |
||
sociality = social |
0a |
|
||
crop = sunflower |
-3.8** |
0.002 |
||
crop = watermelon |
0a |
|
||
[lecty=polylectic]*[crop=sunflower] |
-0.25 |
0.70 |
||
[lecty=oligolectic]*[crop=sunflower] |
0a |
|
||
[lecty=polylectic]*[crop= watermelon] |
1.7* |
0.016 |
||
[lecty=oligolectic]*[crop= watermelon] |
0a |
|
||
ITD*[crop= sunflower] |
1.0** |
0.004 |
||
ITD*[crop= watermelon] |
-1.2** |
0.001 |
||
dominant species, abundance-based |
intercept |
0.717*** |
0.116 |
|
sociality = solitary |
-0.424** |
0.139 |
||
sociality = social |
0a |
|
||
* P<0.05; ** P<0.01; *** P<0.001
a This coefficient is set to zero because it is redundant.

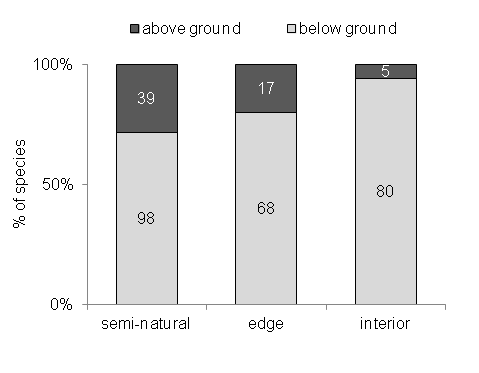
Fig. D1. Distribution of nesting guilds among bee species sampled from different habitats. Numbers inside columns indicate species richness.

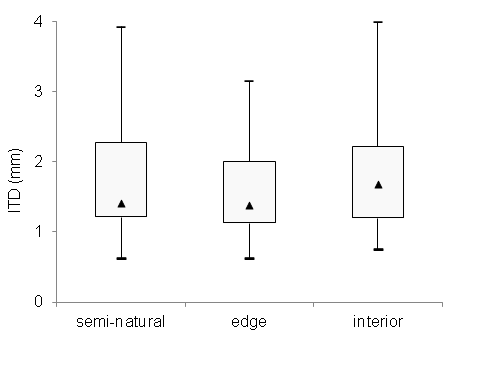
Fig. D2. Distribution of inter-tegular distances (ITD; median, quartiles, and range) among bee species sampled from different habitats.

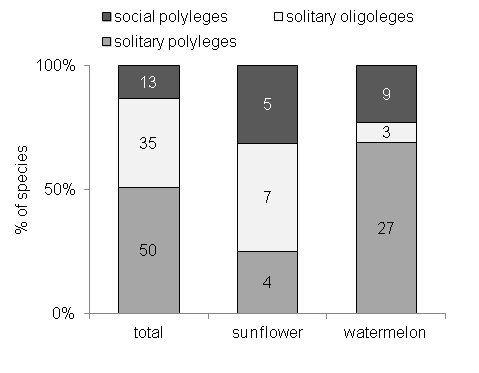
Fig. D3. Distribution of sociality and lecty among bee species sampled from crop flowers vs. the total community. Numbers inside columns indicate species richness.

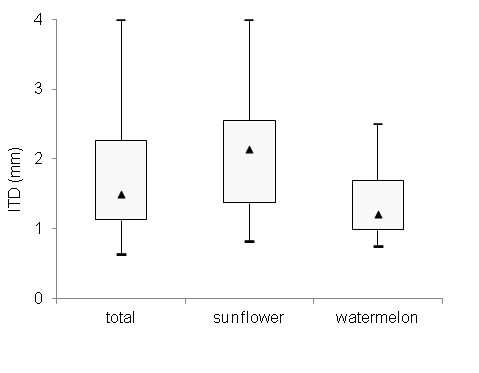
Fig. D4. Distribution of inter-tegular distances (ITD; median, quartiles, and range) among bee species sampled from crop flowers vs. the total community.