Ecological Archives A025-043-A1
Gideon Pisanty and Yael Mandelik. 2015. Profiling crop pollinators: life history traits predict habitat use and crop visitation by Mediterranean wild bees. Ecological Applications 25:742752. http://dx.doi.org/10.1890/14-0910.1
Appendix A. Percentage of semi-natural habitat surrounding the edge plots and its correlation with measures of bee diversity.
Table A1. Semi-natural habitat surrounding the edge plots for each crop system
crop (# sites) |
radius (m) |
median % cover (range) |
almond (23) |
50 |
6 (0–52) |
2500 |
37 (6–83) |
|
sunflower (29) |
50 |
21 (0–60) |
2500 |
32 (8–78) |
|
watermelon (32) |
50 |
25 (0–56) |
2500 |
41 (10–77) |
Table A2. Correlation coefficients between percent semi-natural habitat and bee abundance/species richness in watermelon edge plots, for different radii and bee groups.
radius |
habitat preference |
capture method |
nesting guild |
|||||||||
abundance |
sp. richness |
abundance |
sp. richness |
abundance |
sp. richness |
|||||||
agr. |
nat. |
agr. |
nat. |
net |
trap |
net |
trap |
belowg. |
aboveg. |
belowg. |
aboveg. |
|
50 |
.296 |
.484** |
.018 |
.592** |
.626** |
.341 |
.620** |
.198 |
.348 |
.613** |
.114 |
.652** |
100 |
.327 |
.489** |
.038 |
.476** |
.567** |
.395* |
.498** |
.237 |
.375* |
.619** |
.085 |
.585** |
250 |
.440* |
.548** |
.169 |
.467** |
.544** |
.517** |
.461** |
.382* |
.481** |
.646** |
.181 |
.570** |
500 |
.401* |
.477** |
.183 |
.441* |
.427* |
.465** |
.379* |
.365* |
.428* |
.536** |
.201 |
.501** |
1000 |
.521** |
.507** |
.288 |
.505** |
.496** |
.540** |
.442* |
.474** |
.519** |
.541** |
.308 |
.526** |
1500 |
.532** |
.539** |
.319 |
.581** |
.546** |
.545** |
.513** |
.496** |
.536** |
.561** |
.361* |
.572** |
2000 |
.534** |
.588** |
.357* |
.605** |
.573** |
.563** |
.537** |
.510** |
.560** |
.577** |
.400* |
.569** |
2500 |
.504** |
.583** |
.356* |
.611** |
.555** |
.539** |
.538** |
.487** |
.539** |
.553** |
.404* |
.554** |
agr., species with high agricultural affinity (associated with agricultural habitats); nat., species with low agricultural affinity (associated with semi-natural habitats); net, individuals netted from crop flowers; trap, individuals collected in ground-level pan traps; belowg., below ground nesters; aboveg., above ground nesters; * P < 0.05; ** P < 0.01
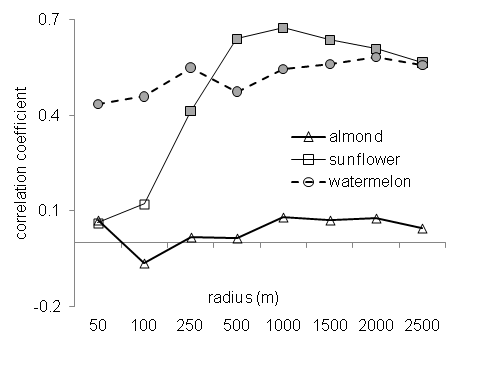
Fig. A1. Correlation between the percentage of semi-natural habitat and wild bee abundance in edge plots at eight different radii, for almond (23 sites), sunflower (29 sites) and watermelon (32 sites) sites. Significant correlations are indicated by filled markers.
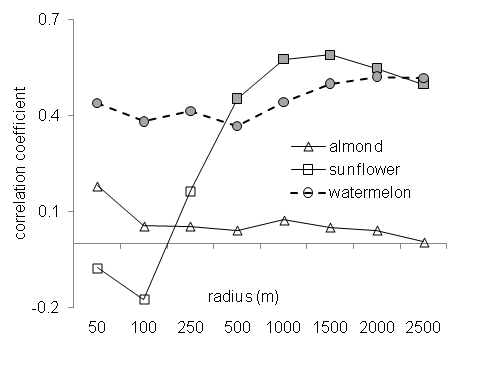
Fig. A2. Correlation between the percentage of semi-natural habitat and wild bee species richness in edge plots at eight different radii, for almond (23 sites), sunflower (29 sites) and watermelon (32 sites) sites. Significant correlations are indicated by filled markers.
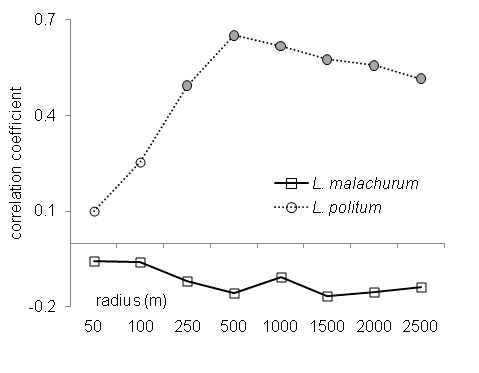
Fig. A3. Correlation between the percentage of semi-natural habitat and bee abundance in edge plots at eight different radii, for the main crop visitor species in sunflower fields. Significant correlations are indicated by filled markers.
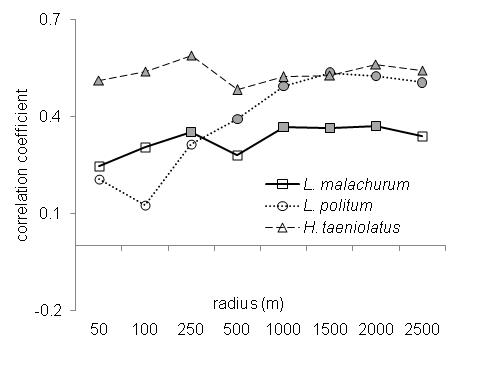
Fig. A4. Correlation between the percentage of semi-natural habitat and bee abundance in edge plots at eight different radii, for the main crop visitor species in watermelon fields. Significant correlations are indicated by filled markers.