Ecological Archives A025-041-A2
Sigrid D. P. Smith, Peter B. McIntyre, Benjamin S. Halpern, Roger M. Cooke, Adrienne L. Marino, Gregory L. Boyer, Andy Buchsbaum, G. A. Burton Jr., Linda M. Campbell, Jan J. H. Ciborowski, Patrick J. Doran,11 Dana M. Infante,12 Lucinda B. Johnson, Jennifer G. Read, Joan B. Rose, Edward S. Rutherford, Alan D. Steinman, and J. David Allan. 2015. Rating impacts in a multi-stressor world: a quantitative assessment of 50 stressors affecting the Great Lakes. Ecological Applications 25:717728. http://dx.doi.org/10.1890/14-0366.1
Appendix B. Additional tables and figures for survey of Great Lakes experts, including additional data displays of respondents, new stressors, and components of ecosystem impact.
Table B1. Additional stressors which respondents suggested were not included in Great Lakes survey (Part IIB responses). We summarized 58 individual responses from 246 people reaching Part II, of which 196 respondents completed Part IIA as instructed. One response is sometimes classified in more than one topic below, since some responses had multiple ideas mentioned.
Response topic |
No. (n = 58) |
Hydrology or water level regulation new stressor (sometimes with management comment) |
14 |
Disease-related new stressor (e.g., fish/bird pathogens, SSOs, septic tanks) |
10 |
Other new stressors:
|
9 (1 each unless noted) |
Variations of included stressors, such as broadening stressors (e.g., lumping all bioaccumulating toxics as one stressor) |
28 |
Management concern (e.g., funding shortfall) |
6 |
Interactions among stressors |
3 |
Feedback about survey instrument |
4 |
Table B2. Distribution and attrition statistics for the survey of Great Lakes experts.
Stage of invitation/survey |
No. of people |
Responses (%) |
Total original invitation attempts |
787 |
|
Known undeliverable emails* |
- 114** |
|
Total invitations sent (approximate) |
721** |
|
|
|
|
Out of office auto-replies |
- 13 |
|
Declined survey (removal requests) |
- 24 |
|
Opened link to survey |
306 |
100 |
Reached page 2 (survey instructions) |
296 |
97 |
Reached Part II instructions |
276 |
90 |
Reached Part IIA |
246 |
80 |
Reached Part III |
237 |
77 |
Reached Part IV instructions |
170 |
56 |
Filled out at least some of Part IV |
141 |
46 |
Clicked end twice (for Qualtrics "finish") |
140 |
46 |
*We were able to measure bounced emails and auto-replies by sending one mailing from Microsoft Outlook, but we were unable to measure the number of messages not read by recipients, such as from spam filters.
**For 48 of the bounced emails (11 to NGO and 37 to literature experts), we found a new address and resent it, but these people had less time to complete the survey, and we do not know whether the new invitations were received due to only using Qualtrics for resending.
Table B3. Stated duration of experience/expertise of respondents for each lake and zone in the survey of Great Lakes experts. Shown are the number of respondents selecting the given answer from multiple choice questions in Part I of the survey. Respondents chose answers for each lake and zone separately, and they were able to choose responses for "no specialization" as well (data not shown).
A. By lake
Lake |
1 (no experience) |
2 (1–2 yr) |
3 (3–5 yr) |
4 (6–10 yr) |
5 (>10 yr) |
Superior |
51 |
26 |
40 |
27 |
54 |
Michigan |
50 |
20 |
30 |
35 |
67 |
Huron |
53 |
19 |
30 |
35 |
55 |
Erie |
39 |
26 |
28 |
35 |
67 |
Ontario |
63 |
26 |
22 |
26 |
53 |
B. By zone
Zone |
1 (no experience) |
2 (1–2 yr) |
3 (3–5 yr) |
4 (6–10 yr) |
5 (>10 yr) |
Wetland-rivermouth |
36 |
29 |
32 |
37 |
66 |
Littoral, hard substrate |
45 |
19 |
24 |
34 |
56 |
Littoral, soft substrate |
36 |
15 |
32 |
33 |
61 |
Sublittoral, hard substrate |
58 |
18 |
24 |
23 |
43 |
Sublittoral, soft substrate |
48 |
15 |
28 |
22 |
53 |
Offshore |
58 |
9 |
27 |
21 |
65 |
Tributaries and/or whole watershed |
21 |
16 |
30 |
36 |
107 |
Table B4. Weights (shown as proportions) for the importance of 5 components of ecosystem impact (mean ± 1 SD) from scenario comparisons in the survey of experts in the Laurentian Great Lakes. Results are shown for respondents by self-declared primary work activity and for all respondents combined."Other" activities included all other responses, such as restoration, advocacy, and teaching. See Methods and Appendix A for details
Primary work activity |
n |
Spatial extent |
Frequency |
Ecological scope |
Magnitude |
Recovery time |
Research |
78 |
0.21 ± 0.11 |
0.14 ± 0.10 |
0.22 ± 0.12 |
0.20 ± 0.11 |
0.24 ± 0.10 |
Natural resource management |
24 |
0.21 ± 0.11 |
0.14 ± 0.10 |
0.22 ± 0.12 |
0.20 ± 0.11 |
0.24 ± 0.11 |
Other |
21 |
0.20 ± 0.11 |
0.17 ± 0.11 |
0.21 ± 0.12 |
0.20 ± 0.11 |
0.22 ± 0.11 |
All respondents |
123 |
0.21 ± 0.11 |
0.13 ± 0.10 |
0.22 ± 0.12 |
0.21 ± 0.11 |
0.23 ± 0.10 |
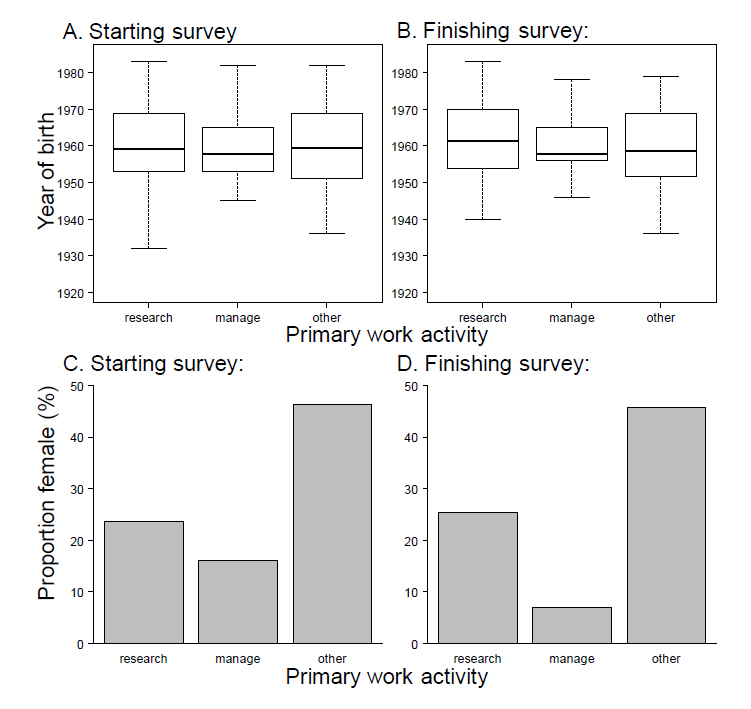
Fig. B1. Respondent demographics for the Great Lakes expert survey, for both respondents who started the survey (left panels) and officially finished it (i.e., selected button to formally record responses; right panels). Shown are year of birth to indicate age (A–B, n = 259 starters, 135 finishers) and proportion of respondents who were female for those who identified themselves as male or female (C–D, n = 264 starters, 136 finishers).
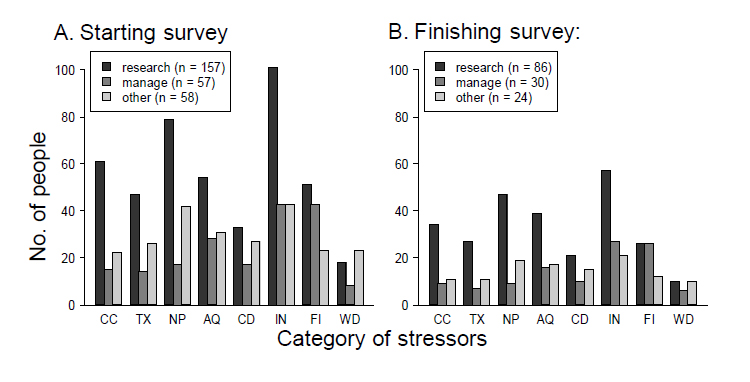
Fig. B2. Categories of stressors for which respondents had experience/expertise from the Great Lakes expert survey, for both respondents who started the survey (left panel; n = 271) and officially finished it (i.e., selected button to formally record responses; right panel; n = 140). Respondents could select as many categories as they desired. Abbreviations: CC = climate change, TX = toxic chemicals, NP = nonpoint source pollutants, AQ = aquatic habitat alterations, CD = coastal development, IN = invasive and nuisance species, FI = fisheries, WD = water withdrawals and diversions.