Ecological Archives A025-035-A3
Heidi Liere, Tania N. Kim, Benjamin P. Werling, Timothy D. Meehan, Douglas A. Landis, and Claudio Gratton. 2015. Trophic cascades in agricultural landscapes: indirect effects of landscape composition on crop yield. Ecological Applications 25:652661. http://dx.doi.org/10.1890/14-0570.1
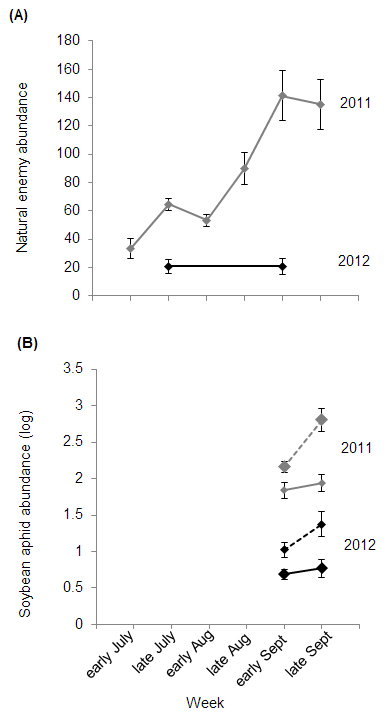
Appendix C. Figure showing the temporal variation of soybean aphids and natural enemies in 2011 and 2012.
Fig. C1. Temporal variation in the mean abundances of natural enemies (A) and soybean aphids (B) in 2011 (gray) and 2012 (black). "Early" and "late" correspond to the first and third weeks of each month, respectively. Natural enemy (NE) abundances were measured from sticky cards left out for two weeks in experimental soybean fields; soybean aphid (SBA) abundances measured on soybean in closed (dashed) and open (solid) cages. NE exclusion cages were set out in soybean fields in early August and SBA infestation occurred in mid-August. For NE, points represent mean abundances captured in a two-week period, per sticky card per experimental field. For SBA, the points represent mean abundances per plant per sampling station across all sites. Bars are ± 1 standard error.