Ecological Archives A025-034-A2
Jeffrey F. Bromaghin, Trent L. McDonald, Ian Stirling, Andrew E. Derocher, Evan S. Richardson, Eric V. Regehr, David C. Douglas, George M. Durner, Todd Atwood, and Steven C. Amstrup. 2015. Polar bear population dynamics in the southern Beaufort Sea during a period of sea ice decline. Ecological Applications 25:634–651. http://dx.doi.org/10.1890/14-1129.1
Appendix B. Southern Beaufort Sea polar bear capture statistics.
Table B1. The number of southern Beaufort Sea polar bears captured (N), and the number (M) and percentage (%) that were previously captured, by sex (♀ = Female, ♂ = Male), year, and age-class in the USGS data set.
|
|
Cub |
|
Yearling |
|
Subadult |
|
Adult |
|||||||
Sex |
Year |
N |
|
N |
M |
% |
|
N |
M |
% |
|
N |
M |
% |
|
♀ |
2001 |
11 |
|
15 |
- |
- |
|
9 |
- |
- |
|
56 |
- |
- |
|
♀ |
2002 |
11 |
|
2 |
0 |
0.0 |
|
11 |
5 |
45.5 |
|
48 |
24 |
50.0 |
|
♀ |
2003 |
5 |
|
1 |
0 |
0.0 |
|
8 |
4 |
50.0 |
|
33 |
15 |
45.5 |
|
♀ |
2004 |
11 |
|
2 |
0 |
0.0 |
|
18 |
2 |
11.1 |
|
47 |
17 |
36.2 |
|
♀ |
2005 |
7 |
|
1 |
0 |
0.0 |
|
8 |
1 |
12.5 |
|
32 |
17 |
53.1 |
|
♀ |
2006 |
4 |
|
7 |
1 |
14.3 |
|
8 |
1 |
12.5 |
|
31 |
15 |
48.4 |
|
♀ |
2007 |
5 |
|
4 |
0 |
0.0 |
|
3 |
1 |
33.3 |
|
26 |
13 |
50.0 |
|
♀ |
2008 |
6 |
|
0 |
0 |
- |
|
10 |
1 |
10.0 |
|
33 |
19 |
57.6 |
|
♀ |
2009 |
10 |
|
6 |
3 |
50.0 |
|
2 |
1 |
50.0 |
|
36 |
24 |
66.7 |
|
♀ |
2010 |
5 |
|
3 |
1 |
33.3 |
|
2 |
1 |
50.0 |
|
27 |
16 |
59.3 |
|
|
|
|
|
|
|
|
|
|
|
|
|
|
|
|
|
♂ |
2001 |
9 |
|
11 |
- |
- |
|
3 |
- |
- |
|
21 |
- |
- |
|
♂ |
2002 |
10 |
|
4 |
1 |
25.0 |
|
13 |
4 |
30.8 |
|
19 |
2 |
10.5 |
|
♂ |
2003 |
11 |
|
4 |
1 |
25.0 |
|
8 |
4 |
50.0 |
|
37 |
4 |
10.8 |
|
♂ |
2004 |
13 |
|
6 |
1 |
16.7 |
|
19 |
9 |
47.4 |
|
32 |
10 |
31.3 |
|
♂ |
2005 |
14 |
|
1 |
0 |
0.0 |
|
6 |
4 |
66.7 |
|
27 |
15 |
55.6 |
|
♂ |
2006 |
4 |
|
0 |
0 |
- |
|
5 |
3 |
60.0 |
|
31 |
20 |
64.5 |
|
♂ |
2007 |
6 |
|
2 |
0 |
0.0 |
|
3 |
0 |
0.0 |
|
31 |
15 |
48.4 |
|
♂ |
2008 |
7 |
|
1 |
0 |
0.0 |
|
4 |
0 |
0.0 |
|
27 |
15 |
55.6 |
|
♂ |
2009 |
11 |
|
7 |
2 |
28.6 |
|
0 |
0 |
- |
|
40 |
22 |
55.0 |
|
♂ |
2010 |
8 |
|
7 |
2 |
28.6 |
|
3 |
2 |
66.7 |
|
20 |
16 |
80.0 |
|
Table B2. The number of southern Beaufort Sea polar bears captured (N), and the number (M) and percentage (%) that were previously captured, by sex (♀ = Female, ♂ = Male), year, and age-class in the USCA data set.
|
|
Cub |
|
Yearling |
|
Subadult |
|
Adult |
|||||||
Sex |
Year |
N |
|
N |
M |
% |
|
N |
M |
% |
|
N |
M |
% |
|
♀ |
2001 |
11 |
|
15 |
- |
- |
|
9 |
- |
- |
|
56 |
- |
- |
|
♀ |
2002 |
11 |
|
2 |
0 |
0.0 |
|
11 |
5 |
45.5 |
|
48 |
24 |
50.0 |
|
♀ |
2003 |
10 |
|
3 |
0 |
0.0 |
|
15 |
5 |
33.3 |
|
49 |
17 |
34.7 |
|
♀ |
2004 |
17 |
|
9 |
1 |
11.1 |
|
39 |
6 |
15.4 |
|
91 |
25 |
27.5 |
|
♀ |
2005 |
14 |
|
9 |
0 |
0.0 |
|
29 |
9 |
31.0 |
|
87 |
34 |
39.1 |
|
♀ |
2006 |
8 |
|
11 |
2 |
18.2 |
|
10 |
4 |
40.0 |
|
54 |
25 |
46.3 |
|
♀ |
2007 |
5 |
|
8 |
0 |
0.0 |
|
7 |
6 |
85.7 |
|
44 |
22 |
50.0 |
|
♀ |
2008 |
7 |
|
2 |
0 |
0.0 |
|
10 |
1 |
10.0 |
|
43 |
27 |
62.8 |
|
♀ |
2009 |
12 |
|
10 |
4 |
40.0 |
|
5 |
4 |
80.0 |
|
54 |
34 |
63.0 |
|
♀ |
2010 |
5 |
|
6 |
1 |
16.7 |
|
3 |
1 |
33.3 |
|
40 |
22 |
55.0 |
|
|
|
|
|
|
|
|
|
|
|
|
|
|
|
|
|
♂ |
2001 |
9 |
|
11 |
- |
- |
|
3 |
- |
- |
|
21 |
- |
- |
|
♂ |
2002 |
10 |
|
4 |
1 |
25.0 |
|
13 |
4 |
30.8 |
|
19 |
2 |
10.5 |
|
♂ |
2003 |
13 |
|
5 |
1 |
20.0 |
|
19 |
4 |
21.1 |
|
53 |
5 |
9.4 |
|
♂ |
2004 |
21 |
|
9 |
1 |
11.1 |
|
32 |
15 |
46.9 |
|
73 |
16 |
21.9 |
|
♂ |
2005 |
17 |
|
7 |
0 |
0.0 |
|
19 |
7 |
36.8 |
|
69 |
31 |
44.9 |
|
♂ |
2006 |
8 |
|
2 |
0 |
0.0 |
|
9 |
4 |
44.4 |
|
48 |
29 |
60.4 |
|
♂ |
2007 |
6 |
|
5 |
2 |
40.0 |
|
5 |
4 |
80.0 |
|
36 |
19 |
52.8 |
|
♂ |
2008 |
8 |
|
1 |
0 |
0.0 |
|
6 |
2 |
33.3 |
|
31 |
19 |
61.3 |
|
♂ |
2009 |
13 |
|
11 |
2 |
18.2 |
|
3 |
1 |
33.3 |
|
49 |
35 |
71.4 |
|
♂ |
2010 |
8 |
|
11 |
2 |
18.2 |
|
3 |
2 |
66.7 |
|
21 |
17 |
81.0 |
|
Table B3. The number of times individual polar bears were captured during the study period. Initial captures of new bears in 2010 are included.
No. times |
USGS |
USCA |
1 |
516 |
767 |
2 |
115 |
200 |
3 |
47 |
72 |
4 |
26 |
32 |
5 |
9 |
12 |
6 |
1 |
2 |
7 |
1 |
1 |
Total |
715 |
1,086 |

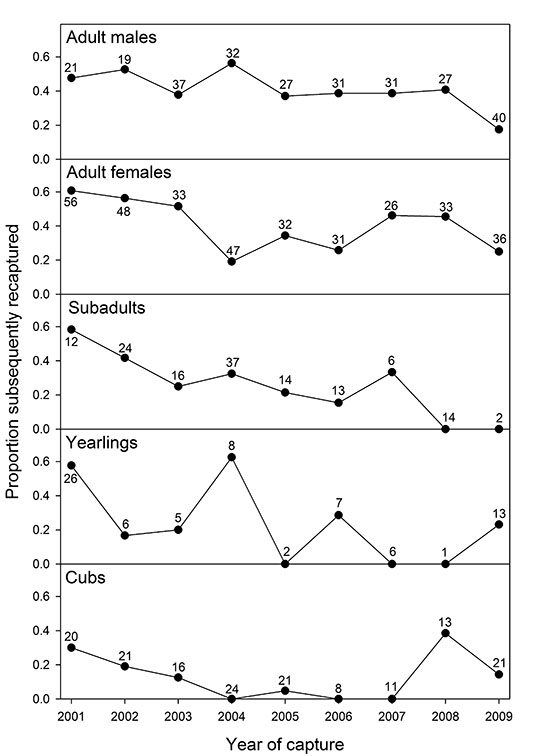
Fig. B1. The proportion of individuals subsequently recaptured by capture year and age class for the USGS data set. Numbers co-located with data points indicate the number of bears captured each year.

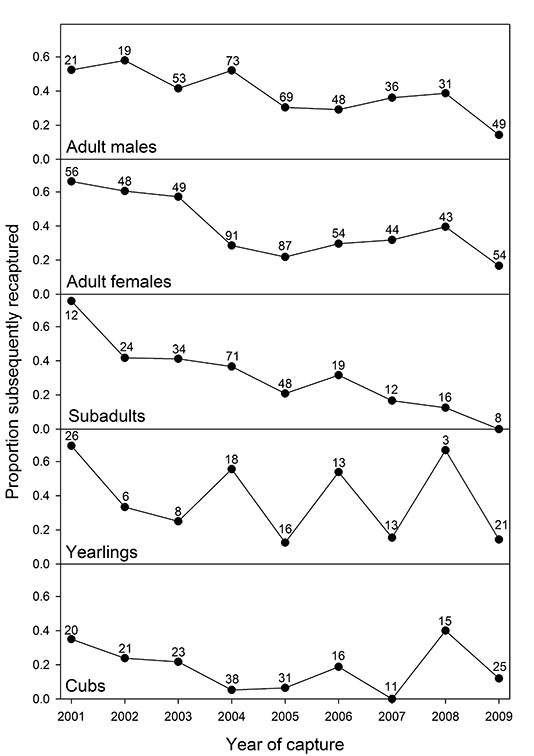
Fig. B2. The proportion of individuals subsequently recaptured by capture year and age class for the USCA data set. Numbers co-located with data points indicate the number of bears captured each year.