Ecological Archives A025-033-A2
Suzanne M. O'Regan, Krisztian Magori, J. Tomlin Pulliam, Marcus A. Zokan, Rajreni B. Kaul, Heather D. Barton, and John M. Drake. 2015. Multi-scale model of epidemic fade-out: Will local extirpation events inhibit the spread of white-nose syndrome? Ecological Applications 25:621633. http://dx.doi.org/10.1890/14-0417.1
Appendix B. Maximum likelihood point estimates for multi-scale model parameters and spread predictions for multi-scale model with gamma-distributed extirpation time.
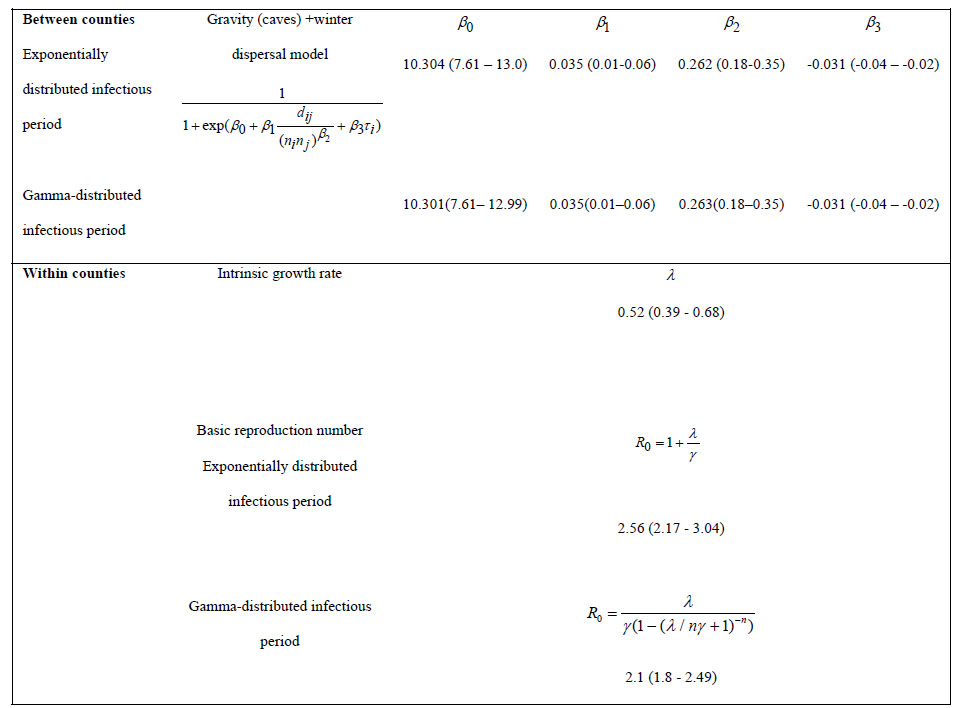
Table B1. Maximum likelihood point estimates for the parameters of the SIR multi-scale models. Approximate 95% confidence intervals are in parentheses. Parameters for the between-county gravity and winter dispersal model agree closely with those found by Maher et al. (2012). A generalized linear model was fitted to cave infection history data to estimate the intrinsic growth rate of the infection λ and a hibernaculum extirpation time 1/γ of 3 years was used to obtain the point estimate for R0. The R0 =2.56 point estimate was then used to calculate the transmission rate between hibernacula within counties in the SIR multi-scale model with exponentially distributed infectious period. The R0 =2.1 point estimate was used to calculate the transmission rate between hibernacula within counties in the SIR multi-scale model with gamma-distributed infectious period.
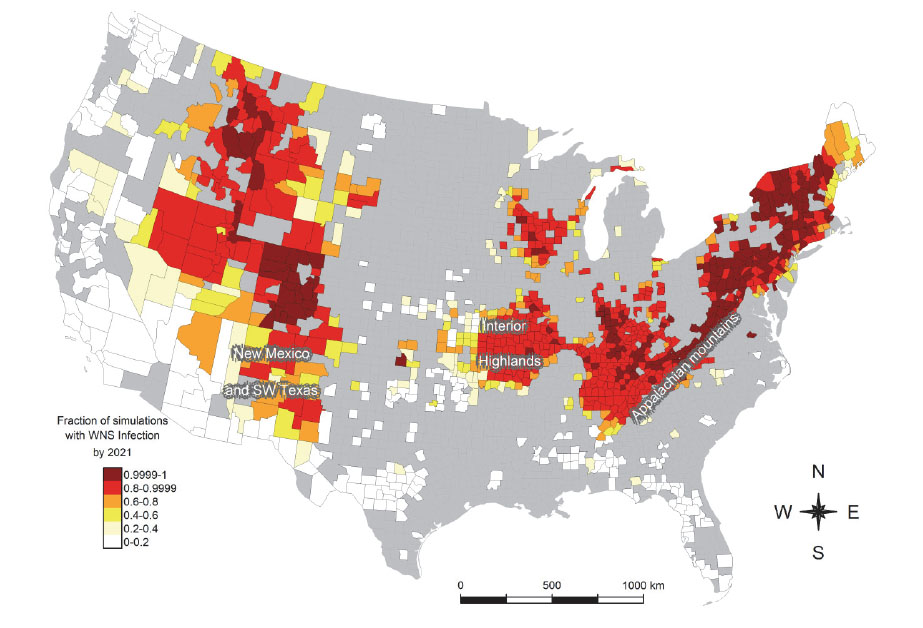
Fig. B1. The predicted spread of White-nose Syndrome in the contiguous United States by year 2021, assuming a gamma-distributed hibernaculum extirpation time of 3 years. Counties are colored according to the fraction of simulations that they were infected with WNS out of 10,000 simulations. The pattern of WNS infection, indicating that the dominant cave-bearing formations of the U.S. have a near-certain risk of infection by 2021, is similar to Fig. 1 of the main text. Counties colored gray have no potential hibernacula and were excluded from the model. All simulations were initialized using the observed infected counties up to 1st June 2011 (U.S.Fish and Wildlife Service, 2011).
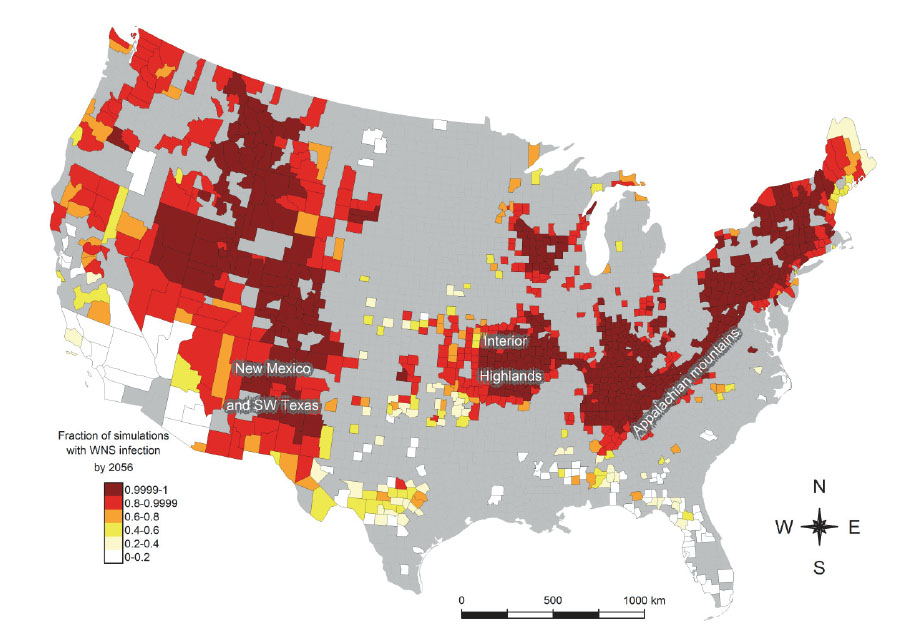
Fig. B2. The predicted spread of White-nose Syndrome in the contiguous United States by year 2056, assuming an exponentially distributed hibernaculum infectious period of 3 years. Counties are colored according to the fraction of simulations that they were infected with WNS out of 10,000 simulations. By 2056, there is a high probability that WNS will reach the western seaboard. Counties colored grey have no potential hibernacula and were excluded from the model. All simulations were initialized using the observed infected counties up to 1st June 2011 (U.S. Fish and Wildlife Service, 2011).
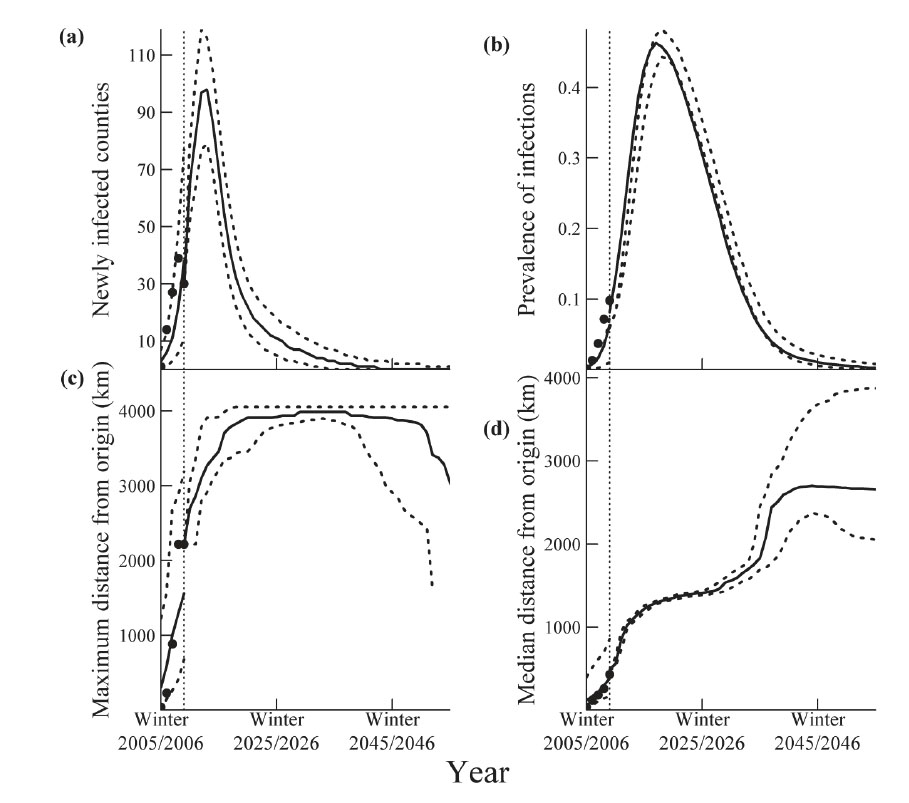
Fig. B3. Statistics summarizing propagation of SIR epidemic with gamma-distributed hibernaculum infectious period. SIR multi-scale projections assume a hibernaculum extirpation time of 3 years. The dotted vertical line divides (i) simulated spread from Schoharie County, NY, from the winter of 2005–2006 to the 2010–2011 state and (ii) forecasts obtained by forward simulation from the 2010–2011 state. Solid lines are median values and dashed lines represent 95% prediction intervals. (a) Number of newly infected counties per year; (b) Proportion of infected counties; (c) Maximum distance from the origin (Schoharie County); (d) Median distance from Schoharie County.
Literature cited
Maher, S. P., Kramer, A. M., Pulliam, J. T., Zokan, M. A., Bowden, S. E., Barton, H. D., Drake, J. M. (2012). Spread of white-nose syndrome on a network regulated by geography and climate. Nature Communications 3, 1306. doi:10.1038/ncomms2301
U.S. Fish and Wildlife Service, 2011. Retrieved January 17, 2014, from http://www.whitenosesyndrome.org/resources/map