Ecological Archives A025-022-A1
A. Waldron, R. Justicia, and L. E. Smith. 2015. Making biodiversity-friendly cocoa pay: combining yield, certification, and REDD for shade management. Ecological Applications 25:361372. http://dx.doi.org/10.1890/13-0313.1
Appendix A. Tables showing Pearson product-moment correlations between explanatory variables, coefficients and hypothesis testing from best-fitting model using all trees and using all larger trees, and the management model using the coefficients from the all-tree analysis, and a figure depicting a model planting plan that achieves zero canopy cover and yet three to four neighboring shade trees (within 10 m) for each cocoa tree, with very few exceptions.
Additional Results and Management Applications
Table A1. Pearson product-moment correlations between explanatory variables (df = 262). Total shade dbh and average shade distance correlations use a data set with zero-shade cocoa trees removed (df = 199 ).
|
Density of large shade trees |
Canopy cover |
Hemis-pherical cover |
Mean shade dbh |
Mean shade distance |
Cocoa dbh |
Cocoa age |
Planting density |
Density of all shade trees |
0.89 |
0.38 |
0.37 |
NA |
NA |
-0.06 |
-0.06 |
-0.20 |
Density of large shade trees |
|
0.42 |
0.43 |
0.72 |
0.06 |
0.13 |
-0.005 |
-0.19 |
Canopy cover overhead |
|
|
0.59 |
0.32 |
0.52 |
-0.02 |
-0.07 |
-0.06 |
Hemispherical cover |
|
|
|
0.36 |
-0.08 |
-0.06 |
-0.26 |
0.08 |
Total shade dbh |
|
|
|
|
0.05 |
0.16 |
0.13 |
-0.14 |
Average shade distance |
|
|
|
|
|
0.10 |
-0.01 |
-0.09 |
Cocoa dbh |
|
|
|
|
|
|
0.51 |
0.06 |
Cocoa age |
|
|
|
|
|
|
|
-0.05 |
Table A2. Coefficients and hypothesis testing from best-fitting model using all trees.
Term |
Slope coefficient |
T value |
p value |
Intercept |
5.150726 |
3.645 |
0.000267 |
dbh |
-0.872027 |
-2.514 |
0.011946 |
Canopy cover |
-0.010073 |
-5.706 |
1.15e-08 |
Shade density |
1.077478 |
2.617 |
0.008872 |
Shade density² |
-0.278497 |
-2.560 |
0.010465 |
Region |
0.308062 |
2.816 |
0.004861 |
Planting density |
-1.930112 |
-3.773 |
0.000161 |
dbh × planting density |
0.482302 |
3.744 |
0.000181 |
Table A3. Coefficients and hypothesis testing from best-fitting model using all larger trees (dbh>10cm).
Term |
Slope coefficient |
T value |
p value |
Intercept |
5.101549 |
3.665 |
0.000247 |
dbh |
-0.902569 |
-2.628 |
0.008601 |
Canopy cover |
-0.010509 |
-5.895 |
3.75e-09 |
Shade density |
1.392192 |
3.356 |
0.000792 |
Shade density² |
-0.378871 |
-3.123 |
0.001789 |
Region |
0.253698 |
2.293 |
0.021841 |
Planting density |
-1.969572 |
-3.891 |
9.98e-05 |
dbh × planting density |
0.494444 |
3.880 |
0.000105 |
Table A4. The management model using the coefficients from the all-tree analysis.
Neighboring trees |
0 |
1 |
2 |
3 |
3.2 |
4 |
5 |
6 |
Canopy cover |
||||||||
0 |
65.7 |
86.9 |
96.6 |
99.9 |
100.0 |
99.0 |
95.4 |
90.0 |
5 |
62.5 |
82.6 |
91.8 |
95.0 |
95.1 |
94.2 |
90.7 |
85.6 |
10 |
59.4 |
78.6 |
87.3 |
90.3 |
90.4 |
89.5 |
86.3 |
81.4 |
15 |
56.5 |
74.7 |
83.0 |
85.9 |
86.0 |
85.1 |
82.0 |
77.4 |
20 |
53.7 |
71.1 |
79.0 |
81.7 |
81.8 |
81.0 |
78.0 |
73.6 |
25 |
51.1 |
67.6 |
75.1 |
77.7 |
77.7 |
77.0 |
74.2 |
70.0 |
30 |
48.6 |
64.2 |
71.4 |
73.8 |
73.9 |
73.2 |
70.5 |
66.5 |
35 |
46.2 |
61.1 |
67.9 |
70.2 |
70.3 |
69.6 |
67.1 |
63.3 |
40 |
43.9 |
58.1 |
64.6 |
66.8 |
66.8 |
66.2 |
63.8 |
60.2 |
45 |
41.8 |
55.2 |
61.4 |
63.5 |
63.6 |
62.9 |
60.6 |
57.2 |
50 |
39.7 |
52.5 |
58.4 |
60.4 |
60.4 |
59.8 |
57.7 |
54.4 |
55 |
37.8 |
49.9 |
55.5 |
57.4 |
57.5 |
56.9 |
54.8 |
51.7 |
60 |
35.9 |
47.5 |
52.8 |
54.6 |
54.6 |
54.1 |
52.1 |
49.2 |
65 |
34.2 |
45.2 |
50.2 |
51.9 |
52.0 |
51.5 |
49.6 |
46.8 |
70 |
32.5 |
42.9 |
47.7 |
49.4 |
49.4 |
48.9 |
47.1 |
44.5 |
75 |
30.9 |
40.8 |
45.4 |
46.9 |
47.0 |
46.5 |
44.8 |
42.3 |
80 |
29.4 |
38.8 |
43.1 |
44.6 |
44.7 |
44.2 |
42.6 |
40.2 |
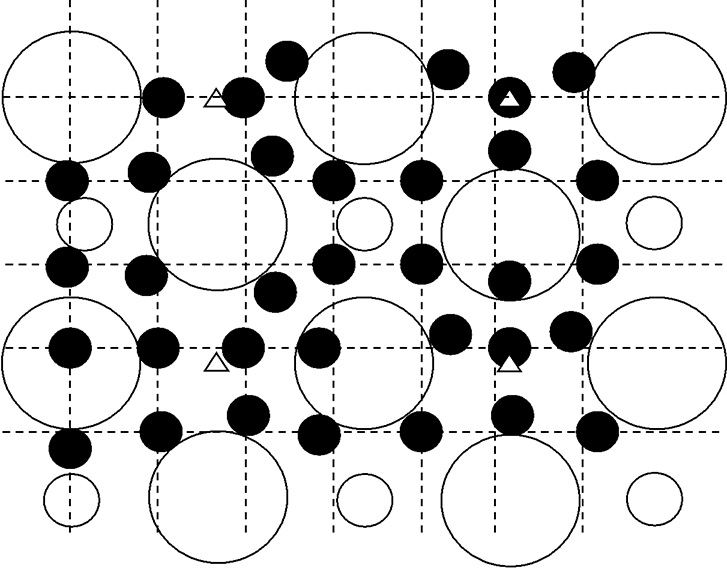
Illustrative planting pattern using optima of neighboring trees and canopy cover
Yield was optimized when canopy cover was zero but there were three neighbouring shade trees. The models also suggest that four neighboring shade trees would cause minimal yield losses if canopy cover above the cocoa crop itself could be controlled, creating a highly viable scenario for ecolabelling. We therefore sought a planting pattern that might be able to combine zero canopy cover above the crop with the appropriate number of neighbor trees.
Mean crown diameter for the 308 large shade trees measured was 8.2 m but farmers themselves indicated to us a variety of shade tree options, some with narrower crowns and some with more extensive crowns. We therefore created a spatial model in which there were three simulated classes of tree: large trees with a 10-m crown diameter, narrow-crowned shade trees with a crown diameter of 4 m such as Cordia alliadora and many palm species, and trees that intercept only a negligible amount of direct overhead light. These latter could be short fruiting trees, very tall trees (which only cast direct overhead shadow for a few minutes of each day on each cocoa tree) or deciduous trees that lose their leaves during the critical period when cocoa flowers and the pods fill out (Somarriba 2004).
These three tree types are planted at 10-m distances in a matrix arrangement so that each cocoa tree has four shade trees within 10 m of it, of which one should intercept minimal light. Cocoa trees are sown into the shade matrix 6 m apart from each other, a typical planting density for the Choco, and are assumed to have crown diameters of three metres. As can be seen, with small adjustments in planting position, it is possible to achieve a situation in which nearly all cocoa trees have zero canopy cover and yet also have three to four shade trees at ten metres or less. Additionally, the few trees that do have canopy cover have the maximum amount of light from the sides, which should reduce the yield lost from being under canopy cover (as suggested by our results for hemispherical canopy cover).
Trees with the crown characteristics shown in this planting plan, including trees with characteristics that minimize light interception such as palms, trees that shed their leaves when cocoa fruits are filling in, and narrow-crowned trees, are already preferred by many farmers, and so recommending them is culturally appropriate and increases the likelihood of adoption of the plan.
Fig. A1. A model planting plan that achieves zero canopy cover and yet three to four neighboring shade trees (within 10 m) for each cocoa tree, with very few exceptions. Circles represent tree crowns and are drawn to scale. Open symbols = shade trees, closed circles = cocoa trees. Large shade trees are 10 m in crown diameter, mid-sized shade trees are 4 m in crown diameter. Triangles give minimal overhead shade (see text). Dashed lines indicate a ruled 6 × 6 m planting matrix, from which cocoa trees are sometimes slightly shifted to minimize canopy cover. Shade tree stems are 10 m distant from each other. An alternative to shifting cocoa stems would be to prune shade crowns.
Explanations for transformation decisions
Shade tree density was sqrt(x+0.5) transformed, firstly because it is a count statistic, and secondly because we expected that the yield response to the addition of one further shade tree should decline in magnitude as the number of shade trees increased. The same transformation was applied to cocoa planting density, under the same rationale. Cocoa dbh was ln-transformed because we expected yield to respond to proportional changes in cocoa tree diameter, and this supposition was confirmed by investigative plots of the yield/dbh relationship. Shade tree dbh and cocoa age were ln-transformed for the same reason. Indeed, studies of the age-yield relationship suggest that harvest roughly increases with the logarithm of age in young trees (Dand 2010). Distance to shade trees was square root-transformed because we expected impacts to vary with the square of distance, and exploratory plots confirmed the reasonableness of this supposition. Exploratory plots of yield against canopy cover and hemispherical cover did not suggest the need for any transformation. Epiphyte load was ln-transformed after examining diagnostic plots.
Sensitivity to assumptions
In addition to the sensitivity testing associated with the use of different sets of coefficients, we also checked sensitivity to certain methodological assumptions. Our basic measure of yield was the number of healthy, harvestable cocoa pods on the tree. This measure discards all pods that have been attacked by squirrels and those that have become unharvestable due to disease. The implicit assumption here is that "squirrel" pods have the same proportion of sick and healthy pods as the non-squirrel pods. An alternative assumption could be that squirrels only attack pods which are healthy and which would universally remain healthy until harvest. Under such a scenario, squirrel pods should be considered part of yield and added to the total of healthy pods. We therefore reanalyzed the data using summed healthy and squirrel pods as our measure of yield. The best fitting model remained unchanged and the management recommendation was for no canopy cover and 3.1 neighbor trees.
Literature cited
Dand, R. 2010. The international cocoa trade. Woodhead Publishing, Cambridge, UK.
Somarriba, E. 2004. Cómo mejorar el dosel de sombra en cacaotales? Agroforesteria en las Americas 41-42:120–128.