Ecological Archives A025-020-A1
Michael T. Hallworth, T. Scott Sillett, Steven L. van Wilgenburg, Keith A. Hobson, and Peter P. Marra. 2015. Migratory connectivity of a Neotropical migratory songbird revealed by archival light-level geolocators. Ecological Applications 25:336347. http://dx.doi.org/10.1890/14-0195.1
Appendix A. Detailed model selection for modeling Ovenbird nonbreeding abundance from eBird data and apparent survival.
Nonbreeding abundance - We considered multiple competing models for nonbreeding abundance of Ovenbirds in which we modeled the number of Ovenbirds detected at non-breeding locations submitted via eBird checklists. Ovenbird abundance was modeled using checklists submitted via eBird checklists from 2010–2013. The candidate model set consisted of twelve models which included biologically relevant variables that may influence abundance. We included elevation, Normalized Difference Vegetation Index (NDVI), the change in NDVI from November to March and longitude of the location from where checklists were submitted. In addition, we included a constant model (null model) which included no covariates. We considered models with main effects and included models with up to second order polynomial (quadratic) terms for longitude and elevation. Elevation and elevation2 were included in the candidate set to account for a difference in or preference for elevation in Ovenbird abundance, respectively. NDVI was included in the model set to account for habitat. Ovenbirds have been detected in a variety of habitat types throughout the Caribbean, however they are often detected in dry forest types (Wunderle and Waide 1993). We included the change in NDVI (ΔNDVI) from November to March to identify areas that dry out throughout the nonbreeding season, characteristic of dry forests. ΔNDVI values < 0 indicate browning while values > 0 indicate greening as the non-breeding season progresses. Longitude was included as a variable to account for differences in abundance throughout the non-breeding distribution. Longitude2 was included to account for the potential for larger abundance estimates in the core of the nonbreeding distribution. Variables associated with site observations were also included in the model set to account for imperfect detection. We included the total number of observation minutes per checklist location as an observation covariate to account for observation duration. The total number of checklists submitted per location may also influence the number of Ovenbirds detected thus we included number of checklists per location in our candidate model set. An information theoretic approach (Burnham and Anderson 2001) was used to compare models in the candidate model set. Models with ΔAICc < 2.0 receive substantial support balancing goodness-of-fit while minimizing the number of parameters (Burnham and Anderson 2001).
Apparent Survival- Apparent survival was estimated from annual capture-mark and recapture / re-sight data of male Ovenbirds from Hubbard Brook Experimental Forest, NH between 2010–2012 using Cormack-Jolly-Seber (CJS) models analyzed with RMark (Laake 2013). We incorporated geolocator as a covariate to determine whether geolocators influenced apparent survival and/or detection probabilities. We also ran models that allowed survival and detection probabilities to vary through time as well as a null model that assumed constant survival and detection probabilities. The candidate model set was then assessed using Akaikie's Information Criterion (AIC).
RESULTS
Apparent Survival- The most parsimonious model that influenced apparent survival and detection probabilities included geolocator as a covariate (Table A4). However, the apparent survival for individuals with geolocators (n = 66; 0.675 ± 0.06) was higher than individuals without geolocators (n = 148; 0.549 ± 0.08). Detection probability was also higher for individuals with geolocators (0.939 ± 0.06) than individuals without (0.665 ± 0.11).
Table A1. Sun elevation angles used to calculate latitude and longitude from light transition data obtained with archival light-level geolocators. Ovenbirds were captured across a broad geographic range throughout the breeding and non-breeding distribution. We used the mean breeding and non-breeding sun elevation angles to locate individuals when captured during the nonbreeding and breeding seasons, respectively. The number of geolocators and transition events (sunrise or sunset) used to calculate sun elevation angles are also shown.
Capture Location |
Sun Elevation Angle (°) |
Geolocators |
Transition events |
Geographic Coordinates |
Breeding |
-1.335 ± 0.15 |
28 |
2664 |
|
Canada |
-2.233 ± 0.10 |
8 |
469 |
53°90'N 106°18'E |
New Hampshire |
-0.976 ± 0.62 |
20 |
2195 |
43°93'N 73°71'E |
Nonbreeding |
-3.409 ± 0.11 |
16 |
1511 |
|
Florida |
-3.559 ± 0.37 |
3 |
134 |
25°13'N 80°94'E |
Jamaica |
-3.369 ± 0.54 |
9 |
719 |
18°04'N 77°93'E |
Puerto Rico |
-3.384 ± 0.34 |
4 |
658 |
17°97'N 66°86'E |
Belize* |
1.194 |
1 |
59 |
16°55'N 88°71'E |
*reference geolocator placed near the forest floor
Table A2. eBird checklists were used to determine the nonbreeding season abundance of Ovenbirds modeled using N-mixture models with the 'unmarked' package in R. Model selection was used to determine which distribution best fit the eBird abundance data when abundance (λ) and detection probability (ᴪ) were held constant.
Distribution |
K |
AIC |
ΔAIC |
Model Weight |
Cumulative Model Weight |
Negative Binomial |
3 |
8676.59 |
0.00 |
1.00 |
1.00 |
Zero inflated Poisson |
3 |
9817.31 |
1140.72 |
0.00 |
1.00 |
Poisson |
2 |
14021.30 |
5344.71 |
0.00 |
1.00 |
Table A3. eBird checklists were used to determine the nonbreeding season abundance of Ovenbirds modeled using N-mixture models with the 'pcount' function in 'unmarked' package in R. Model selection was used to determine which parameters influenced Ovenbird abundance during the nonbreeding season. The model most parsimonious model included elevation2 and the change in normalized difference vegetation index (NDVI) between November and March on abundance, while the sum of count minutes (Mins) for each month influenced detection. Beta estimates from the most parsimonious model were used to create an abundance map during the nonbreeding season.
Model |
K |
AIC |
ΔAIC |
Model Weight |
Cumulative Model Weight |
λ(Elevation2 + NDVI) p(Mins) |
6 |
8242.74 |
0.00 |
0.86 |
0.86 |
λ (NDVI) p(Mins) |
5 |
8246.37 |
3.63 |
0.14 |
1.00 |
λ (.) p(Mins) |
4 |
8269.57 |
26.83 |
0.00 |
1.00 |
λ (Elevation) p(Mins) |
5 |
8271.54 |
28.80 |
0.00 |
1.00 |
λ (.) p(Counts) |
4 |
8380.39 |
137.65 |
0.00 |
1.00 |
λ(Elevation2 + NDVI) p(NDVI) |
6 |
8618.22 |
375.47 |
0.00 |
1.00 |
λ(Elevation2 + NDVI) p(.) |
5 |
8653.27 |
410.53 |
0.00 |
1.00 |
λ (NDVI) p(.) |
4 |
8657.42 |
414.68 |
0.00 |
1.00 |
λ (Elevation + NDVI) p(.) |
5 |
8659.27 |
416.53 |
0.00 |
1.00 |
λ (.) p(.) |
3 |
8676.59 |
433.85 |
0.00 |
1.00 |
λ (Longitude2) p(.) |
4 |
8678.41 |
435.67 |
0.00 |
1.00 |
λ (Longitude2 + Elevation) p(.) |
5 |
8680.33 |
437.59 |
0.00 |
1.00 |
Table A4. Apparent survival (ϕ) and detection probabilities (p) were estimated using program MARK through the RMark package in R. Geolocator was included as a covariate to estimate the influence of geolocators on apparent survival of Ovenbirds breeding at Hubbard Brook Experimental Forest, NH. The most parsimonious model indicated that geolocators influence both apparent survival and detection probability of male Ovenbirds. However, apparent survival and detection probability was higher for individuals with geolocators than males without.
Model |
K |
AICc |
ΔAICc |
Model Weight |
Cumulative Model Weight |
ϕ (Geolocator) p(Geolocator) |
4 |
342.09 |
0.00 |
0.45 |
0.45 |
ϕ (Time) p(Geolocator) |
5 |
342.19 |
0.09 |
0.43 |
0.88 |
ϕ (Geolocator) p(.) |
3 |
344.59 |
2.50 |
0.13 |
0.99 |
ϕ (.) p(.) |
2 |
354.63 |
12.54 |
0.01 |
1.00 |
ϕ (Time) p(Time) |
6 |
361.16 |
19.07 |
0.00 |
1.00 |
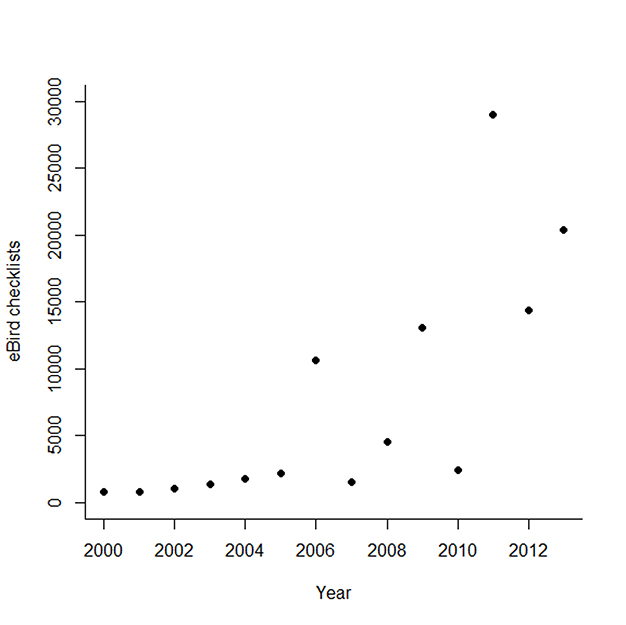
Fig. A1. Number of eBird checklists submitted that reported effort, and every species detected that occurred within the non-breeding distribution of Ovenbirds between 1 November and 31 March. The number of checklists has increased exponentially since 2008.
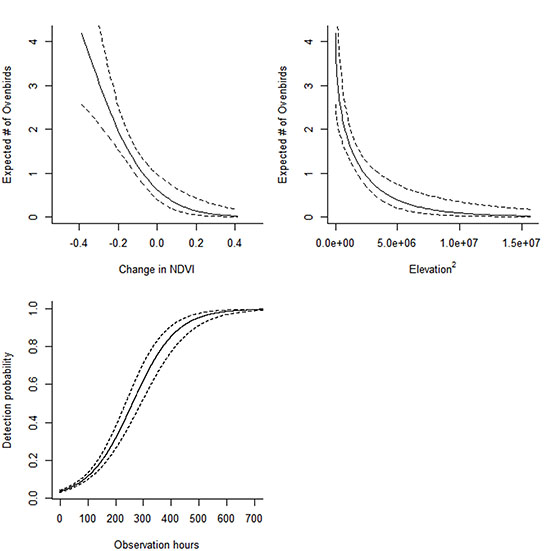
Fig. A2. The influence of change in Normalized Difference Vegetation Index (NDVI) from November to March and elevation2 (m) on Ovenbird abundance during the nonbreeding season obtained via eBird checklists between 1 November and 31 March during 2010–2013. NDVI values < 0 indicate browning, values = 0 indicate no change, while values > 0 indicate greening from November to March. The estimated number of Ovenbirds (solid line) and 95% CI of the estimates (dotted lines) as a function of difference in NDVI values (A) and elevation2 (B). Detection probability (solid line) and 95% CI of detection probability as a function of the number of count minutes (depicted in hours).
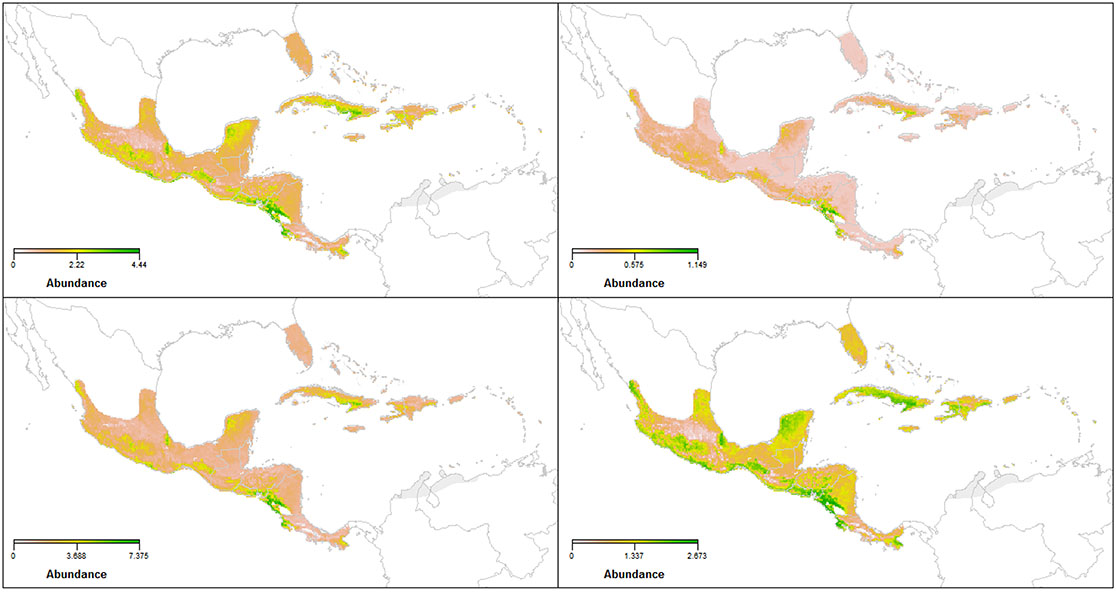
Fig. A3. Predicted Ovenbird abundance (top left), and the SE (top right), upper (bottom left) and lower (bottom right) estimates of most parsimonious model (λ(Elevation2 + NDVI) p(Mins)) derived via eBird checklists during the non-breeding season with N-mixture models in the 'unmarked' R package.
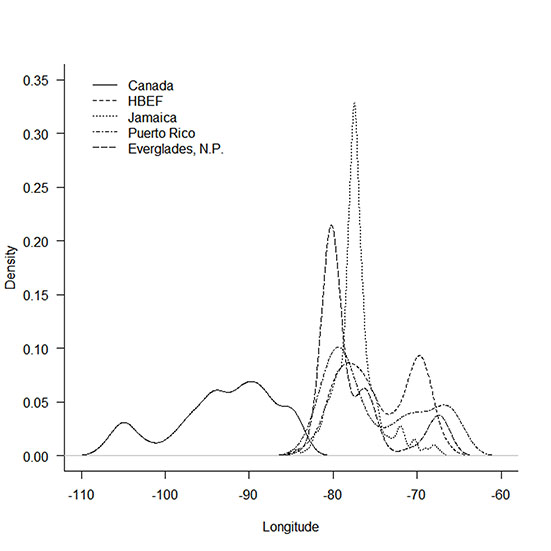
Fig. A4. Longitudinal estimates derived using archival light-level geolocators during fall migration (1 September–31 October) of Ovenbirds captured at two breeding (Canada, HBEF) and four nonbreeding locations (Everglades National Park, Jamaica, and Puerto Rico). We were unable to determine migratory routes during fall because Ovenbirds migrate during the autumnal equinox when estimates of latitude are unreliable.
Literature cited
Burnham, K. P., and D. R. Anderson. 2001. Kullback-Leibler information as a basis for strong inference in ecological studies. Wildlife Research 28:111–120.
Laake, J. L. 2013. RMark: An R interface for analysis of capture-recapture data with MARK. Alaska Fisheries Science Center., NOAA, Natl. Mar. Fish. Serv., 7600 Sand Point Way NE, Seattle WA 98115.
Wunderle, J. M., and R. B. Waide. 1993. Distribution of overwintering Nearctic migrants in the Bahamas and Greater Antilles. The Condor 95:904–933.