Ecological Archives A025-017-A4
K. M. Giljohann, M. A. McCarthy, L. T. Kelly, and T. J. Regan. 2015. Choice of biodiversity index drives optimal fire management decisions. Ecological Applications 25:264–277. http://dx.doi.org/10.1890/14-0257.1
Appendix D. Optimal strategy and expected value of the reserve for the reptile-only analysis.
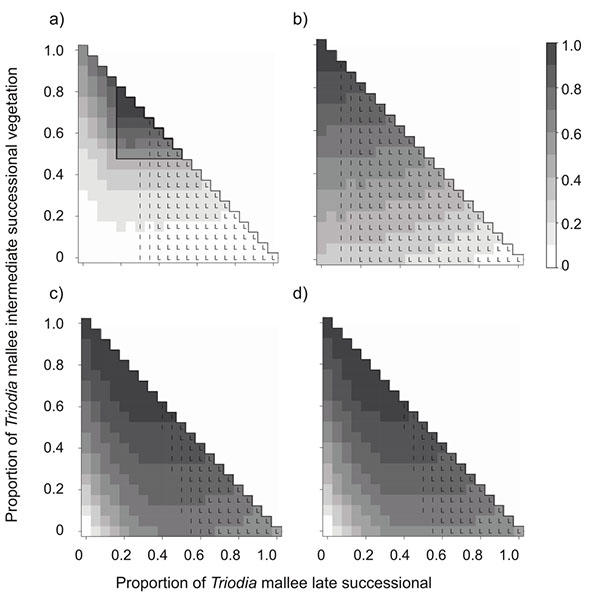
Fig. D1. Optimal strategy and expected value of the reserve for the 11 reptile species over a 100-year period. The relative habitat value of each state is represented by the gray scale; with 1 being the optimal value. The objective functions are (a) Binary: constrain to have 55% intermediate and 45% late; (b) maximize the arithmetic mean probability of species occurrence; (c) maximize the geometric mean probability of species occurrence; (d) minimize extinction risk. The optimal stratgey for each state of the reserve is denoted by a letter: L burn 20% late; l burn 10% late; fight all wildfires has no letter. Taking no action and burning intermediate successional vegetation was never optimal.