Ecological Archives A025-016-A4
Ryan McManamay and Emmanuel A. Frimpong. 2015. Hydrologic filtering of fish life history strategies across the United States: implications for stream flow alteration. Ecological Applications 25:243263. http://dx.doi.org/10.1890/14-0247.1
Appendix D. Geographic and operational stratification of predicted trait-frequency responses to dam regulation.
Geographic and Operational Stratification of Predicted Trait-Frequency Responses to Dam Regulation
Provinces and Ecoregions have been previously utilized in studies comparing the classification strength (% variation explained in ecological patterns) of alternative frameworks (Wolock et al. 2004; Frimpong and Angermeier 2010). The importance of hydrologic classifications, i.e., groups of streams that share similar hydrology, has also been widely recognized with regard to providing context to hydrologic and ecological responses to disturbance (Arthington et al. 2006; Poff et al. 2010). Classifying dams by their operational purpose can also provide a template to evaluate hydrologic and ecological responses to dam regulation (Poff and Hart 2002).
The National Inventory of Dams (NID) provides 11 different purposes for dams, each of which may have multiple purposes whose order indicates relative importance (USACE 2013). Because 180 unique purposes were identified in the current dataset, we developed five simplified categories of purposes hypothesized to have varying effects on hydrology, and thus ecology: diversion, other (recreation, farm ponds), water supply, flood control (includes navigation), flood control + water supply, hydropower, and hydropower + additional purposes. NID purpose does not indicate the presence or extent of diversion; thus, diversion dams were identified using comments from SGS water reports, gauge names, or dam names that included the words "diversion", "bypass", "transbasin", etc.
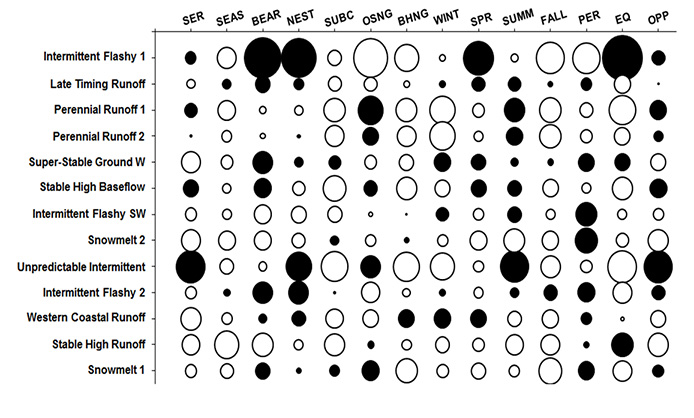
Classification systems were compared in their ability to explain variation in hydrologic and trait-frequency responses using Permutational MANOVAs. Variation explained in hydrology and trait-frequency responses to dam regulation is provided in Table D1. Trait-frequency responses summarized by hydrologic classes are provided in Fig. D1.
Table D1. Variation explained in hydrologic responses or trait responses according to geographic regions or according to dam operations (i.e., purpose). Analyses were conducted using a permutational MANOVA. Each geographic region was assessed individually and in combination with dam purpose.
|
Individual |
|
Purpose Combined |
||||||
|
df |
R² |
R² adj. |
p |
|
df |
R² |
R² adj. |
p |
Hydrology |
|||||||||
Hydrologic Classes |
12 |
0.14 |
0.09 |
0.020 |
18 |
0.17 |
0.10 |
0.040 |
|
EcoRegions |
14 |
0.08 |
0.02 |
0.168 |
20 |
0.12 |
0.04 |
0.139 |
|
Provinces |
21 |
0.06 |
0.00 |
0.624 |
27 |
0.10 |
0.00 |
0.604 |
|
Purpose |
6 |
0.02 |
0.00 |
0.327 |
--- |
--- |
--- |
--- |
|
All Variables |
|||||||||
Reproductive Strategies |
|||||||||
Hydrologic Classes |
12 |
0.15 |
0.11 |
0.010 |
18 |
0.19 |
0.13 |
0.010 |
|
EcoRegions |
14 |
0.11 |
0.05 |
0.050 |
20 |
0.14 |
0.06 |
0.069 |
|
Provinces |
21 |
0.15 |
0.07 |
0.139 |
27 |
0.18 |
0.08 |
0.079 |
|
Purpose |
6 |
0.05 |
0.03 |
0.030 |
--- |
--- |
--- |
--- |
|
Life History Groups |
|||||||||
Hydrologic Classes |
12 |
0.12 |
0.08 |
0.010 |
18 |
0.18 |
0.11 |
0.010 |
|
EcoRegions |
14 |
0.32 |
0.27 |
0.010 |
20 |
0.33 |
0.28 |
0.010 |
|
Provinces |
21 |
0.16 |
0.08 |
0.059 |
27 |
0.20 |
0.10 |
0.050 |
|
Purpose |
6 |
0.03 |
0.00 |
0.307 |
--- |
--- |
--- |
--- |
|
Hydrologic Variables Only |
|||||||||
Reproductive Strategies |
|||||||||
Hydrologic Classes |
12 |
0.22 |
0.18 |
0.010 |
18 |
0.23 |
0.17 |
0.010 |
|
EcoRegions |
14 |
0.14 |
0.09 |
0.059 |
20 |
0.17 |
0.10 |
0.020 |
|
Provinces |
21 |
0.25 |
0.18 |
0.010 |
27 |
0.28 |
0.19 |
0.010 |
|
Purpose |
6 |
0.05 |
0.03 |
0.010 |
--- |
--- |
--- |
--- |
|
Life History Groups |
|||||||||
Hydrologic Classes |
12 |
0.23 |
0.19 |
0.010 |
18 |
0.26 |
0.20 |
0.010 |
|
EcoRegions |
14 |
0.18 |
0.13 |
0.010 |
20 |
0.21 |
0.14 |
0.010 |
|
Provinces |
21 |
0.29 |
0.22 |
0.010 |
27 |
0.31 |
0.23 |
0.010 |
|
Purpose |
6 |
0.07 |
0.05 |
0.010 |
|
--- |
--- |
--- |
--- |
Fig. D1. Predicted positive (white) and negative (black) trait-frequency responses to dam-regulation according to hydrologic classes. Responses were predicted using the hydrologic-variable model for all fish and represent average response values divided by standard deviation.
Literature cited
Arthington, A. H., S. E. Bunn, N. L. Poff, and R. J. Naiman. 2006. The challenge of providing environmental flow rules to sustain river systems. Ecological Applications 16:1311–1318.
Frimpong, E. A., and P. L. Angermeier. 2010a. Comparative utility of selected frameworks for regionalizing fish-based bioassessments across the United States. Transactions of the American Fisheries Society 139:1872–1895.
Poff, N. L., and D. D. Hart. 2002. Dams vary and why it matters. BioScience 52:659–668.
Poff, N. L., B. D. Richter, A. H. Arthington, S. E. Bunn, R. J. Naiman, E. Kendy, M. Acreman, C. Apse, B. P. Bledsoe, M. C. Freeman, J. Henriksen, R. B. Jacobson, J. G. Kennen, D. M. Merritt, J. H. O'Keeffe, J. D. Olden, K. Rogers, R. E. Tharme, and A. Warner. 2010. The ecological limits of hydrologic alteration (ELOHA): a new framework for developing regional environmental flow standards. Freshwater Biology 55:147–170.
USACE (U.S. Army Corps of Engineers). 2014. National Inventory of Dams. Accessed May 2, 2014 at: http://geo.usace.army.mil/pgis/f?p=397:12:
Wolock, D. M., T. C. Winter, and G. McMahon. 2004. Delineation and evaluation of hydrologic landscape regions in the United States using geographic information system tools and multivariate statistical analyses. Environmental Management 34:S71–S88.