Ecological Archives A025-016-A1
Ryan McManamay and Emmanuel A. Frimpong. 2015. Hydrologic filtering of fish life history strategies across the United States: implications for stream flow alteration. Ecological Applications 25:243263. http://dx.doi.org/10.1890/14-0247.1
Appendix A. An examination of the distribution of North American fishes within the 3-point life-history continuum and an evaluation of differences between trait values for lotic and lentic fish.
Life-History Continuum of North American Fishes
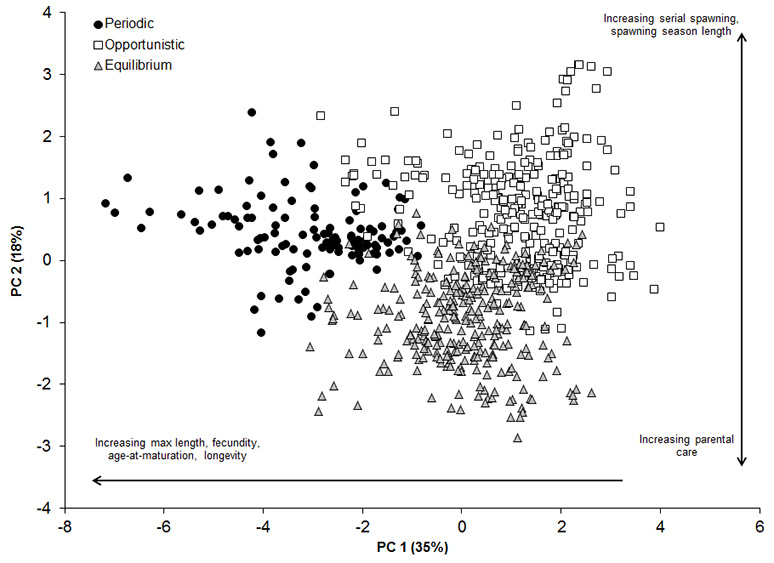
Seven traits, including total length, age-at-maturation, longevity, fecundity, serial spawning, season length, and parental care were used to characterize life history strategies for fish according to Winemiller and Rose (1992). Principal components analysis (PCA) on correlations among the seven traits was used to examine multivariate patterns represented by the species. Species were plotted based on their scores for the first two PCs. A total of 141 species were identified as periodic strategists, 351 as opportunistic strategists, and 358 as equilibrium strategists (Fig A1).
Fig. A1. Multivariate distribution of 850 native freshwater fish species of the US plotted according to one of three life history groups. Variance explained by each PC is indicated in parentheses.
Differences in Trait Values Between Lotic and Lentic Species
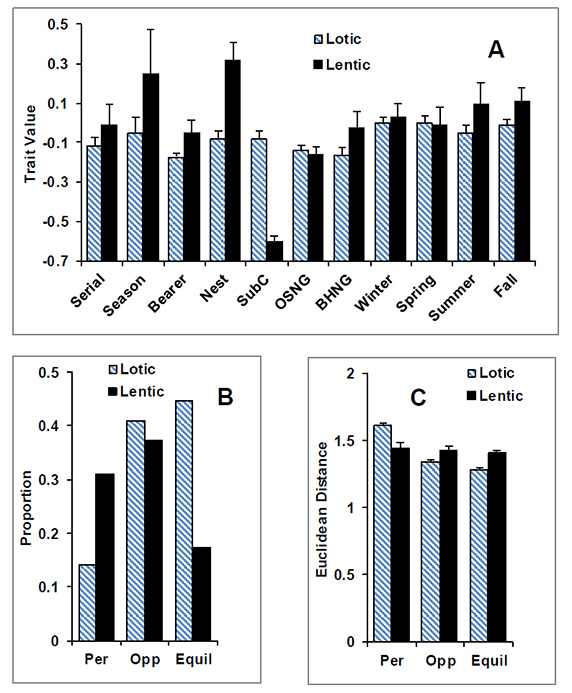
Trait information was summarized separately for all fish species and only fish species preferring lotic environments within each HUC-8. However, it may be important to evaluate differences in trait values for lotic and lentic species. A total of 757 lotic fish species and 110 lentic fish species were represented in our analysis. Many trait values (after controlling for phylogeny) were similar among lotic and lentic species; however, trait values for season length, nest guarding, and substrate-choosers were different among the two groups (Fig. A2A). A higher proportion of periodic species and lower proportion of equilibrium species represented the lentic group compared to the lotic group (Fig. A2B). Average Euclidean distances showed the reciprocal pattern of life-history groups, where lentic species were, on average, closer to the periodic strategy (i.e., shorter distance) and lotic species closer to the equilibrium strategy (Fig. A2C).
Fig. A2. Comparisons of lotic and lentic fish groups using (A) trait values (after controlling for phylogeny), (B) representative proportion of life history groups, and (C) distances to life history endpoints.
Literature cited
Winemiller, K. O., and K. A. Rose. 1992. Patterns of life-history diversification in North American fishes: implication for population regulation. Canadian Journal of Fisheries and Aquatic Sciences 49:2196–2218.