Ecological Archives A025-015-A1
Gabriel I. Yospin, Scott D. Bridgham, Ronald P. Neilson, John P. Bolte, Dominique M. Bachelet, Peter J. Gould, Constance A. Harrington, Jane A. Kertis, Cody Evers, and Bart R. Johnson. 2015. A new model to simulate climate-change impacts on forest succession for local land management. Ecological Applications 25:226242. http://dx.doi.org/10.1890/13-0906.1
Appendix A. CO2 parameterization experiments.
We attempted to explore the CO2 parameterization in MC1 in two ways. The first way was to alter the atmospheric CO2 concentrations that are input into the model. We used the actual A2 CO2 concentrations as the "high" CO2 fertilization effect, a reduced CO2 concentration ramp as the "low" CO2 fertilization effect, and a constant level of CO2 (the recorded, 2006 level) as the "no" CO2 fertilization effect. We found no difference in any MC1 output variables, except for the amount of C4 grass leaf area index, which increased by about 10% over the future period under the "high" CO2 scenario.
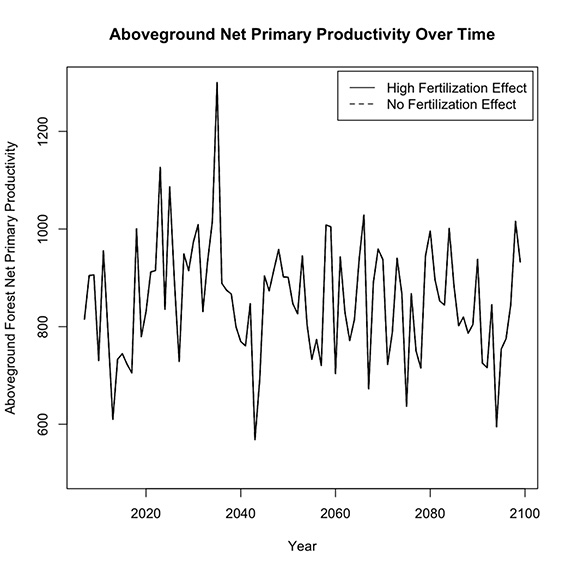
The above approach was not ideal, because it changed the atmospheric concentration of CO2 to achieve a physiological effect. We therefore continued to explore the CO2 fertilization effect in MC1 by changing the parameters that control the efficiency of plant transpiration and photosynthesis: co2itr and co2ipr. co2itr is the effect of doubling CO2 concentration on the rate of transpiration, and co2ipr is the effect of doubling CO2 concentration on the rate of photosynthesis. We ran the model under three different parameterizations of co2itr and co2ipr (Table A1). In 2007 (the first year of the model's future run), the different CO2 fertilization scenarios had no effect on the amount of live tree carbon (Table A2), tree net primary productivity (Fig. A1), leaf shape index, and C4 grass leaf area index.
Table A1. Parameterization of co2itr and co2ipr to achieve different levels of CO2 fertilization in MC1.
CO2 Effect |
co2itr |
co2ipr |
High |
0.4 |
1.6 |
Moderate |
0.75 |
1.25 |
None |
1 |
1 |
Table A2. Live tree carbon (kg/m²) from three points in the study area in 2007.
Grid Cell |
High CO2 Effect |
Moderate CO2 Effect |
No CO2 Effect |
1 |
18.5 |
18.5 |
18.5 |
2 |
22.25 |
22.25 |
22.25 |
3 |
28 |
28 |
28 |
Fig. A1. Aboveground tree NPP (g C/m²) with no CO2 fertilization effect (dashed line), and with the high CO2 fertilization effect (solid line), as specified in Table A1, for grid cell 2 from Table A2. Only one line is visible for this grid cell because the values were identical for the two simulations. All other grid cells examined show identical congruence between no- and high-CO2 fertilization simulations.