Ecological Archives A025-011-A1
Mireia Bartrons, Claudio Gratton, Brian J. Spiesman, and M. Jake Vander Zanden. 2015. Taking the trophic bypass: aquatic-terrestrial linkage reduces methylmercury in a terrestrial food web. Ecological Applications 25:151159. http://dx.doi.org/10.1890/14-0038.1
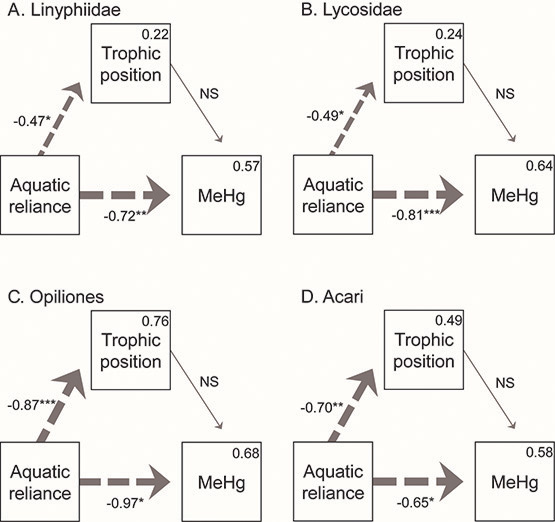
Appendix A. Path diagrams and models output showing the direct and indirect effects of aquatic reliance (δ13C) and trophic position on MeHg.
Fig. A1. Path diagrams showing the direct and indirect effects of aquatic reliance (δ13C) and trophic position on MeHg. Path diagrams for (A) Linyphiidae, (B) Lycosidae, (C) Opiliones, and (D) Acari. Arrow widths are scaled to standardized path coefficients. Dashed gray lines indicate negative effects. Gray hairlines represent nonsignificant (NS) pathways. *P < 0.05, **P < 0.01, and ***P < 0.0001. R² values are given in the upper right corner of variable boxes where appropriate. Path coefficients and p-values are given in Table A2.
Table A1. Trophic position of primary consumers from the four habitat types (Mývatn 200m from shore, Mývatn 5 m from shore, Helluvaðstj’rn 200m from shore, Helluvaðstj’rn 5 m from shore) and from the two lakes (Mývatn and Helluvaðstj’rn):
Herbivore trophic position |
Mývatn 5 m from shore |
Mývatn 200m from shore |
Helluvaðstj’rn 5 m from shore |
Helluvaðstj’rn 200m from shore |
Tingidae |
2.0 |
2.0 |
2.1 |
2.2 |
|
Mývatn |
|
Helluvaðstj’rn |
|
Chironomidae |
1.9 |
|
2.3 |
|
Table A2. Absolute and standardized path coefficients for all taxa combined and each family separately.
Taxa |
Path |
Estimate (absolute) |
SE |
Estimate (standardized) |
P |
All combined (Fig. 3) |
δ13C → Trophic position |
-0.0100 |
0.0018 |
-0.5309 |
0.0003 |
δ13C → MeHg |
-0.0374 |
0.0098 |
-0.3825 |
0.0007 |
|
Trophic position → MeHg |
1.9764 |
0.5210 |
0.3800 |
0.0005 |
|
|
|
|
|
|
|
Linyphiidae (Fig. A1A) |
δ13C → Trophic position |
-0.0132 |
0.0052 |
-0.4665 |
0.0253 |
δ13C → MeHg |
-0.0838 |
0.0179 |
-0.7199 |
0.004 |
|
Trophic position → MeHg |
0.3048 |
0.6342 |
0.0740 |
0.6287 |
|
|
|
|
|
|
|
Lycosidae (Fig. A1B) |
δ13C → Trophic position |
-0.0065 |
0.0024 |
-0.4926 |
0.0170 |
δ13C → MeHg |
-0.0521 |
0.0092 |
-0.8101 |
0.0003 |
|
Trophic position → MeHg |
-0.0845 |
0.6997 |
-0.0173 |
0.9131 |
|
|
|
|
|
|
|
Opiliones (Fig. A1C) |
δ13C → Trophic position |
-0.0179 |
0.0028 |
-0.8730 |
0.0005 |
δ13C → MeHg |
-0.0609 |
0.0200 |
-0.9737 |
0.0140 |
|
Trophic position → MeHg |
-0.5255 |
0.9719 |
-0.1728 |
0.6296 |
|
|
|
|
|
|
|
Acari (Fig. A1D) |
δ13C → Trophic position |
-0.0137 |
0.0036 |
-0.6996 |
0.0045 |
δ13C → MeHg |
-0.0460 |
0.0167 |
-0.6458 |
0.0223 |
|
Trophic position → MeHg |
0.5619 |
0.8488 |
0.1548 |
0.5230 |
Table A3. AIC-based model selection. The path structure of the saturated model is as depicted in Fig. 1. The path from trophic position to MeHg is removed in the reduced model.
A. Linyphiidae model |
K |
log-likelihood |
AIC |
ΔAIC |
Reduced |
5 |
-0.115 |
10.23 |
0.00 |
Saturated |
6 |
0.00 |
12.00 |
1.77 |
|
|
|||
B. Lycosidae model |
K |
log-likelihood |
AIC |
ΔAIC |
Reduced |
5 |
-0.010 |
10.02 |
0.00 |
Saturated |
6 |
0.00 |
12.00 |
1.98 |
|
|
|||
C. Opiliones model |
K |
log-likelihood |
AIC |
ΔAIC |
Reduced |
5 |
-0.145 |
10.29 |
0.00 |
Saturated |
6 |
0.00 |
12.00 |
1.71 |
|
|
|||
D. Acari model |
K |
log-likelihood |
AIC |
ΔAIC |
Reduced |
5 |
-0.215 |
10.43 |
0.00 |
Saturated |
6 |
0.00 |
12.00 |
1.57 |