Ecological Archives A025-009-A8
Alexandre Robert, Stéphane Chantepie, Samuel Pavard, François Sarrazin, and Céline Teplitsky. 2015. Actuarial senescence can increase the risk of extinction of mammal populations. Ecological Applications 25:116124. http://dx.doi.org/10.1890/14-0221.1
Appendix H. Relationships between changes in extinction time associated with actuarial senescence and life history trait predictors in 58 species of mammals: alternative models and parameters.
I. Alternative population sizes
The relationship between changes in population viability associated with actuarial senescence (ΔText) and species predictors is presented below for four different values of the carrying capacity K (Pc=0.14 in all cases). All results are based on Phylogenetic Generalized Least Squares (PGLS) models using the maximum likelihood estimate of Pagel's λ. Only best multiple regression models (obtained after AIC-based selection, details in methods) are presented. Only estimates significantly different from zero are provided ±standard errors (*, p<0.05; **, p<0.01; ***, p<0.001). Predictors are the body mass (Mass), peak adult survival rate (Smax), litter size (LittSize) and number of litters per year (#Litt).
Predictor |
K=50 |
K=100 |
K=250 |
K=500 |
Mass |
|
-0.036±0.01** |
-0.045±0.01** |
|
Smax |
|
0.58±0.28* |
0.92±0.33** |
0.99±0.4* |
LittSize |
|
|
|
0.58±0.26* |
#Litt |
-0.83±0.23*** |
-1.22±0.23*** |
-1.48±0.27*** |
-1.47±0.56** |
#Litt2 |
0.42±0.06*** |
0.53±0.06*** |
0.66±0.08*** |
1.23±0.17*** |
Mass×LittSize |
|
|
|
-0.07±0.03* |
Mass×#Litt |
0.07±0.02* |
0.11±0.02*** |
0.13±0.035** |
0.19±0.05*** |
LittSize×#Litt |
|
|
|
-0.65±0.3* |
The average reductions in population viability obtained with the senescence models as compared with the null models were respectively 24%, 25%, 27% and 31% for K=50, 100, 250 and 500 individuals.
II. Alternative frequencies of catastrophic events
The relationship between changes in population viability associated with actuarial senescence (ΔText) and species predictors is presented below for three different values of the per generation frequency of catastrophic events Pc. (K=250 in all cases). Main results are based on a per generation frequency of catastrophic events Pc equal to 0.14 in all species (see justifications in Reed et al. 2003). Alternative results were obtained with twofold (Pc=0.28) and threefold (Pc=0.42) increases of this frequency.
All results are based on the best multiple regression models (obtained after AIC-based backward selection). Only estimates significantly different from zero are provided ±standard errors (*, p<0.05; **, p<0.01; ***, p<0.001).
Predictor |
Pc=0.14 |
Pc=0.28 |
Pc=0.42 |
Mass |
-0.045±0.01** |
|
|
Smax |
0.92±0.33** |
|
0.25±0.11* |
LittSize |
|
|
|
#Litt |
-1.48±0.27*** |
-0.65±0.16*** |
-0.82±0.03** |
#Litt2 |
0.66±0.08*** |
0.25±0.04** |
0.055±0.017** |
Mass×#Litt |
0.13±0.035** |
|
|
The average reductions in population viability obtained with the senescence models as compared with the null models were respectively 27%, 21%, and 15% for Pc=14%, 28%, and 42%.
III. Second null model: maximum life span model
1. Methods
Like the first null model presented in main results, the "maximum life span"null model assumes that adult survival probability is constant and equal to the peak adult survival rate (Smax). However, it assumes that individuals cannot live longer than L, the physiological maximum life span recorded for animals in captivity (data on L obtained from Lynch and Fagan 2009).
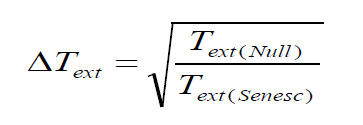
With the first null model, change in median time to extinction ΔTextis computed as
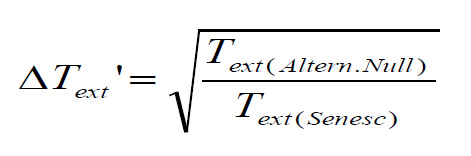
With the maximum life span null model, change in median time to extinction ΔText' is computed as
In both cases, predictors are the body mass (Mass), peak adult survival rate (Smax), litter size (LittSize) and number of litters per year (#Litt). Details of the best models (obtained after AIC-based selection) are provided below. All results are based on PGLS models using the maximum likelihood estimate of Pagel's λ. se: standard error of the estimate; t: Student statistics; F: Fisher statistics; R²: corrected coefficient of determination.
2. Results
The maximum life span null model leads to the same qualitative conclusion as the first null model presented in main results: (1) actuarial senescence is associated with a decrease of viability, with high heterogeneity among species (the average reduction of the median time to extinction is 20.9%, range=[-6%, +68%]); (2) the phylogenetic signal is weak, and (3) life history traits explain a large part of the variance in ΔText' , with a particularly strong (negative) association with the number of litters per year (#Litt). Below is a comparison of detailed statistical results obtained from regressing ΔText and ΔText' on the predictors presented above.
|
First null model (ΔText) |
Second null model (ΔText') |
||||
Predictor |
Estimate±se |
t |
p value |
Estimate±se |
t |
p value |
Mass |
-0.04±0.01 |
-3.09 |
0.003 |
-0.02±0.01 |
-2.31 |
0.0252 |
Smax |
0.92±0.33 |
2.75 |
0.011 |
|
|
|
LittSize |
|
|
|
|
|
|
#Litt |
-1.48±0.28 |
-5.34 |
<10-4 |
-0.17±0.04 |
-4.17 |
0.0001 |
#Litt2 |
0.66±0.08 |
8.41 |
<10-4 |
|
|
|
Mass×#Litt |
0.13±0.03 |
3.76 |
0.0004 |
|
|
|
|
F7,50=34.1; p value<10-4; R²=78%; Pagel's λ<10-3 |
F5,52=6.3; p value=0.0001; R²=30%; Pagel's λ<10-3 |
||||
IV. Third null model: equal mortality model
1. Methods
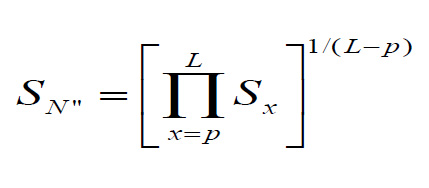
Like the first null model presented in main results, the "equal mortality" null model assumes that the annual adult survival probability is constant. However, here, the constant annual adult death rate is computed such that the same fraction of individuals survives to the maximum life span of the species under both the senescence and null models. The constant annual survival probability of the equal mortality null model is computed as
![]()
where Sx is the survival rate at age x in the senescence model, p is the age of peak survival rate and L is the physiological maximum life span of the species.
Based on these survival rates, an index of change in median time to extinction (hereafter, ΔText'') is computed for each species as for the two previous null models.
3. Results
Contrary to the two other null models, the equal mortality null model is not associated with a reduction of overall mortality relative to the senescence model, but only to a change in the shape of survival curves. In agreement with theoretical expectations (e.g., Pianka and Parker 1975), we found that this third null model is associated with a reduction of the deterministic growth rate λ as compared with the senescence model (because the equal mortality null model leads to a strong reduction of the residual reproductive values of young adults). This reduction of λ is associated with a reduction of viability: the third null model leads to a 64% decrease of the median time to extinction on average, as compared with the senescence model (range [5%–99%]).
Below is a comparison of detailed statistical results obtained from regressing ΔText and ΔText'' on the predictors presented above (All results are based on PGLS models using the maximum likelihood estimate of Pagel's λ).
|
First null model (ΔText) |
Third null model (ΔText'') |
||||
Predictor |
Estimate±se |
t |
p value |
Estimate±se |
t |
p value |
Mass |
-0.04±0.01 |
-3.09 |
0.003 |
|
|
|
Smax |
0.92±0.33 |
2.75 |
0.011 |
-0.87±0.26 |
0.41 |
0.001 |
LittSize |
|
|
|
-0.19±0.06 |
-2.8 |
0.005 |
#Litt |
-1.48±0.28 |
-5.34 |
<10-4 |
-0.18±0.07 |
-2.8 |
0.007 |
#Litt2 |
0.66±0.08 |
8.41 |
<10-4 |
|
|
|
Mass×#Litt |
0.13±0.03 |
3.76 |
0.0004 |
|
|
|
|
F7,50=34.1; p value<10-4; R²=78%; Pagel's λ<10-3 |
F5,52=4.8; p value=0.0009; R²=21%; Pagel's λ<10-3 |
||||
Literature cited
Lynch, H. J., and W. F. Fagan. 2009. Survivorship curves and their impact on the estimation of maximum population growth rates. Ecology 90:1116–1124.
Pianka, E. R., and W. S. Parker. 1975. Age-Specific Reproductive Tactics. American Naturalist 109:453–464.
Reed, D. H., J. J. O'Grady, J. D. Ballou, and R. Frankhman. 2003. The frequency and severity of catastrophic die-offs in vertebrates. Anim. Conserv. 6:109–114.