Ecological Archives A025-006-A1
Elizabeth A. Law, Brett A. Bryan, Erik Meijaard, Thilak Mallawaarachchi, Matthew Struebig, and Kerrie A. Wilson. 2015. Ecosystem services from a degraded peatland of Central Kalimantan: implications for policy, planning, and management. Ecological Applications 25:7087. http://dx.doi.org/10.1890/13-2014.1
Appendix A. Current land use and land cover.
A land use and land cover classification at a 50-m resolution was performed by SarVision as part of the "Master Plan for the Rehabilitation and Revitalization of the Ex-Mega Rice Project Area in Central Kalimantan" (SarVision Netherlands 2008). The classification was based on PALSAR L-band radar data, and using reference data from Landsat satellite imagery, 90-m resolution digital elevation data, MODIS and AATSAR fire hotspot data, land use maps from the Indonesian Ministry of Forestry and Badan Perencana Pembangunan Daerah (BAPPEDA; Indonesian Regional Body for Planning and Development), tree cover percentage map for 2005, ground survey data for 2007-2008, and aerial photographs (SarVision Netherlands 2008). SarVision (2008) note several known inaccuracies of the data, including (a) burnt areas in some cases confused with river-riparian forest, (b) flooded shrubland being poorly defined, (c) tree crops and plantations being under-represented due to similarities in the backscatter signature of shrubland and forest, this includes rubber enrichment areas along rivers, (d) grasslands and ferns confused with shrublands where biomass is particularly high, (e) shrubland classes of different cover percentages being difficult to define(SarVision Netherlands 2008). For this study, a modified typology of land use and land cover types was defined as detailed in Table A1.
Table A1. Land use and land cover descriptions, with simplified classification.
Code |
Short description |
Long description (SarVision Netherlands 2008) |
Simplified classification |
1 |
Riverine-riparian forest (cover >11%) |
Riverine, swamp forest and woodland. The main layer consists of broadleaved evergreen closed to open woodland |
Extant forest |
2 |
Swamp forest (mixed swamp, cover >11%) |
Peat swamp forest cover. Lowland evergreen broadleaved mixed swamp forest. |
Extant forest |
3 |
Woodland – degraded vegetation (cover 1–10%) |
Forest mosaics, degraded. Tree cover <10%, including forests degraded by fire and intensive logging over several years, |
Degraded |
4 |
Shrubland (cover >50%) non-flooded |
Shrubland and forest regrowth. Main layer consists of broadleaved evergreen closed to open vegetation, cover >50%. |
Degraded |
5 |
Shrubland (>50% cover), flooded |
As for (4), with flooding duration estimated to be more than 4 months per year. |
Degraded |
6 |
Shrubland (cover 11–50%) flooded and non flooded |
Shrubs 11–50% cover and remainder herbaceous. |
Degraded |
7 |
Shrubland (cover 1–10%) |
Shrub cover <10%, remainder grass and ferns. |
Degraded |
8 |
Grassland and ferns |
Closed to open herbaceous vegetation, cover >50%, height 0.3–3 m. |
Degraded |
9 |
Water bodies |
Mostly permanent water bodies, but includes areas that may dry out at certain times (e.g., severe El Nino years). |
Water |
10 |
Burnt shrubs and bare |
Recently burnt shrubs, some with regrowth, some bare. |
Degraded |
11 |
Burnt forest and bare |
The main layer consists of closed to open tree cover, recently burnt dead/dry trees standing over new green areas (canopy cover lost). |
Degraded |
12 |
Swamp forest (low pole, cover >11%) |
Lowland evergreen broadleaved forest, low pole swamp forest. Occurring in elevations <1000m above sea level. |
Extant forest |
13 |
Swamp forest (low pole, cover 1–10%) |
Open vegetation with standing low pole trees and shrubs. |
Degraded |
14 |
Mangrove (cover 1–10%) |
Mangroves with sparse crown cover. |
Degraded |
15 |
Mangrove (cover >10%) |
Broadleaved evergreen mangroves over flooded tidal terrain. |
Extant forest |
16 |
Sedges, temporarily flooded |
Regularly flooded areas including sedges (e.g., Thorachostachyum spp.) and pandanus (Pandanus spp.). |
Degraded |
17 |
Fish ponds |
Artificial water bodies used for fish farming. |
NA – Known to exist in study region, |
18 |
Sawah |
Aquatic cultivated and managed areas. |
Sawah |
19 |
Dryland agriculture |
Cultivated and managed areas. |
NA - Reallocated to 25 (potential rubber mosaics) |
20 |
Swamp forest (cover >11%) |
Heath forest (kerangas). Is known to occur in north of block E and near Sebangau NP. |
Extant forest |
21 |
Tree crops |
Includes perennial cash crops and plantations such as acacia, |
NA - Reallocated to (23) coconut tree crops |
22 |
Settlement |
Artificial surfaces and built up areas. |
(Excluded) |
23 |
Tree crops – coconut |
Areas SarVision identified as (21) located close to the river mouth |
Agriculture |
24 |
Tree crops – other |
Areas SarVision identified as (21), not in coconut areas. |
Agriculture |
25 |
Dryland agriculture – rubber |
Dryland agriculture (19) areas that is proximal to rivers on mineral soil, |
Agriculture |
26 |
Dryland agriculture – other |
Dryland agriculture (19) areas away from rivers, and likely to be rice dominated. |
Agriculture |
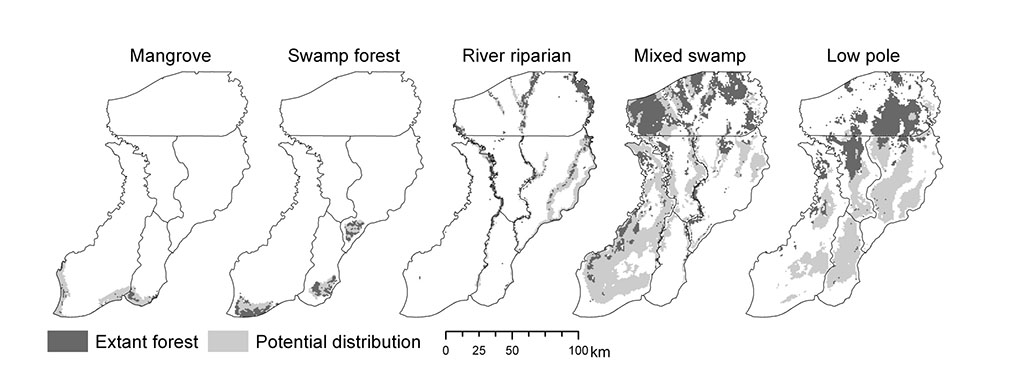
Key variables used to model the potential of each forest type included elevation, peat depth, distance from rivers and ocean, and a subset of climatic variables (WORLDCLIM, http://www.worldclim.org; Hijmans et al. 2005). Each model was fit using a split sample approach (Guisan and Zimmermann 2000), using a random set of presence points (n = 103 to n = 2221, depending on the extant area of each forest type), and reserving 40% of these for testing the performance of each model. Allocation of each 50m x 50m grid cell to a single forest type was performed on the basis of maximum likelihood (Fig. A1). Approximately 16 percent of the study region could not be allocated to a particular forest type with certainty (i.e., there was overlap of the 95 percent confidence intervals between models), and in such cases the dominant extant forest type was assigned manually. For locations where there was discrepancy between the predicted forest type and the extant forest type (in 17 percent of the study region), the extant forest type was assigned (misclassification between low pole and mixed swamp forest types in intergrade areas accounted for 70 percent of these discrepancies).
Fig. A1. Extant and potential distribution of each forest type.
Literature Cited
Guisan, A., and N. E. Zimmermann. 2000. Predictive habitat distribution models in ecology. Ecological Modelling 135:147–186.
Hijmans, R. J., S. E. Cameron, J. L. Parra, P. G. Jones, and A. Jarvis. 2005. Very high resolution interpolated climate surfaces for global land areas. International Journal of Climatology 25:1965–1978.
SarVision Netherlands. 2008. Technical review / analysis number 5: 2007 Land use / land cover map of the Ex-Mega Rice project area in Central Kalimantan.