Ecological Archives A025-005-A2
D. Stralberg, S. M. Matsuoka, A. Hamann, E. M. Bayne, P. Sólymos, F. K. A. Schmiegelow, X. Wang, S. G. Cumming, and S. J. Song. 2015. Projecting boreal bird responses to climate change: the signal exceeds the noise. Ecological Applications 25:5269. http://dx.doi.org/10.1890/13-2289.1
Appendix B. Covariate correlations.
Table B1. Pearson correlation coefficients between climate, topographic, and land-use variables for (a) model-building data set, averaged across 11 bootstrap samples; (b) current period (1961–1990) within boreal and subarctic study area; (c) 2011–2040 within study area; (d) 2041–2070 within prediction area; (e) 2071–2100 within prediction area. See Appendix A Table A1 for climate variable definitions.
(a) model-building data set, averaged across 11 bootstrap samples
CMI |
CMIJJA |
DD0 |
DD5 |
EMT |
MSP |
TD |
CTI |
WETLAND |
AGRICULT |
URBAN |
WATER |
|
CMI |
1.000 |
0.664 |
-0.367 |
-0.036 |
0.489 |
0.721 |
-0.513 |
-0.180 |
-0.016 |
-0.168 |
0.009 |
0.061 |
CMIJJA |
0.664 |
1.000 |
0.099 |
-0.294 |
-0.063 |
0.803 |
-0.041 |
-0.073 |
0.065 |
-0.216 |
-0.057 |
0.045 |
DD0 |
-0.367 |
0.099 |
1.000 |
-0.621 |
-0.876 |
-0.288 |
0.827 |
0.119 |
0.133 |
-0.191 |
-0.135 |
-0.015 |
DD5 |
-0.036 |
-0.294 |
-0.621 |
1.000 |
0.596 |
0.186 |
-0.150 |
0.175 |
-0.058 |
0.375 |
0.167 |
0.020 |
EMT |
0.489 |
-0.063 |
-0.876 |
0.596 |
1.000 |
0.243 |
-0.771 |
-0.072 |
-0.056 |
0.159 |
0.173 |
0.086 |
MSP |
0.721 |
0.803 |
-0.288 |
0.186 |
0.243 |
1.000 |
-0.177 |
-0.054 |
0.028 |
-0.063 |
-0.003 |
0.001 |
TD |
-0.513 |
-0.041 |
0.827 |
-0.150 |
-0.771 |
-0.177 |
1.000 |
0.267 |
0.129 |
-0.028 |
-0.104 |
-0.017 |
CTI |
-0.180 |
-0.073 |
0.119 |
0.175 |
-0.072 |
-0.054 |
0.267 |
1.000 |
0.128 |
0.125 |
0.020 |
0.059 |
WETLAND |
-0.016 |
0.065 |
0.133 |
-0.058 |
-0.056 |
0.028 |
0.129 |
0.128 |
1.000 |
-0.129 |
0.007 |
0.026 |
AGRICULT |
-0.168 |
-0.216 |
-0.191 |
0.375 |
0.159 |
-0.063 |
-0.028 |
0.125 |
-0.129 |
1.000 |
0.020 |
-0.122 |
URBAN |
0.009 |
-0.057 |
-0.135 |
0.167 |
0.173 |
-0.003 |
-0.104 |
0.020 |
0.007 |
0.020 |
1.000 |
0.017 |
WATER |
0.061 |
0.045 |
-0.015 |
0.020 |
0.086 |
0.001 |
-0.017 |
0.059 |
0.026 |
-0.122 |
0.017 |
1.000 |
(b) current period (1961–1990) within boreal and subarctic study area
CMI |
CMIJJA |
DD0 |
DD5 |
EMT |
MSP |
TD |
CTI |
WETLAND |
AGRICULT |
URBAN |
WATER |
|
CMI |
1.000 |
0.905 |
-0.344 |
-0.191 |
0.219 |
0.867 |
-0.581 |
-0.168 |
0.035 |
-0.127 |
-0.002 |
-0.076 |
CMIJJA |
0.905 |
1.000 |
-0.213 |
-0.362 |
0.115 |
0.797 |
-0.587 |
-0.198 |
0.007 |
-0.123 |
-0.008 |
-0.087 |
DD0 |
-0.344 |
-0.213 |
1.000 |
-0.637 |
-0.492 |
-0.621 |
0.647 |
0.045 |
-0.158 |
-0.166 |
-0.019 |
0.067 |
DD5 |
-0.191 |
-0.362 |
-0.637 |
1.000 |
0.303 |
0.216 |
0.089 |
0.194 |
0.190 |
0.233 |
0.025 |
0.036 |
EMT |
0.219 |
0.115 |
-0.492 |
0.303 |
1.000 |
0.269 |
-0.202 |
0.213 |
0.122 |
0.060 |
0.011 |
0.141 |
MSP |
0.867 |
0.797 |
-0.621 |
0.216 |
0.269 |
1.000 |
-0.553 |
-0.131 |
0.092 |
0.008 |
0.005 |
-0.098 |
TD |
-0.581 |
-0.587 |
0.647 |
0.089 |
-0.202 |
-0.553 |
1.000 |
0.283 |
0.015 |
-0.067 |
-0.011 |
0.157 |
CTI |
-0.168 |
-0.198 |
0.045 |
0.194 |
0.213 |
-0.131 |
0.283 |
1.000 |
0.163 |
0.015 |
0.009 |
0.267 |
WETLAND |
0.035 |
0.007 |
-0.158 |
0.190 |
0.122 |
0.092 |
0.015 |
0.163 |
1.000 |
-0.064 |
-0.002 |
-0.084 |
AGRICULT |
-0.127 |
-0.123 |
-0.166 |
0.233 |
0.060 |
0.008 |
-0.067 |
0.015 |
-0.064 |
1.000 |
0.037 |
-0.055 |
URBAN |
-0.002 |
-0.008 |
-0.019 |
0.025 |
0.011 |
0.005 |
-0.011 |
0.009 |
-0.002 |
0.037 |
1.000 |
-0.003 |
WATER |
-0.076 |
-0.087 |
0.067 |
0.036 |
0.141 |
-0.098 |
0.157 |
0.267 |
-0.084 |
-0.055 |
-0.003 |
1.000 |
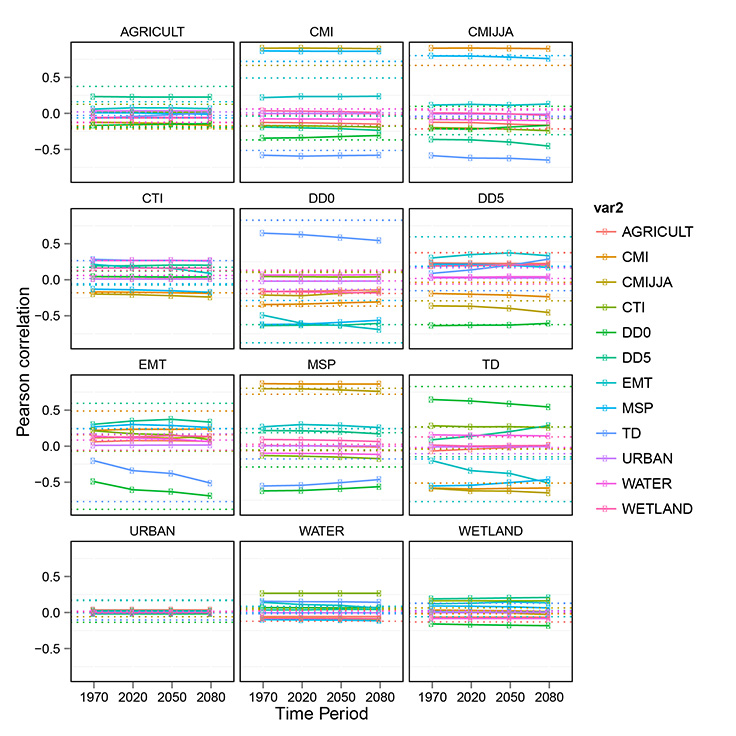
Fig. B1. Changes in mean Pearson correlation coefficients between climate, topographic, and land-use variables over time (solid lines) within the boreal and southern arctic study area, averaged over 19 GCMs for scenario A1. 1970 = current period (1961–1990); 2020 = 2011–2040; 2050 = 2041–2070; 2080 = 2071–2100. Compared with correlation coefficients within the model-building data set averaged across 11 bootstrap samples (dotted lines). See Appendix A Table A1 for climate variable definitions.