Ecological Archives A025-002-A1
Kristine Maciejewski, Alta de Vos, Graeme S. Cumming, Christine Moore, and Duan Biggs. 2015. Cross-scale feedbacks and scale mismatches as influences on cultural services and the resilience of protected areas. Ecological Applications 25:1123. http://dx.doi.org/10.1890/13-2240.1
Appendix A. Step-by-step methodology for creating scale-mismatch vs. resilience plots.
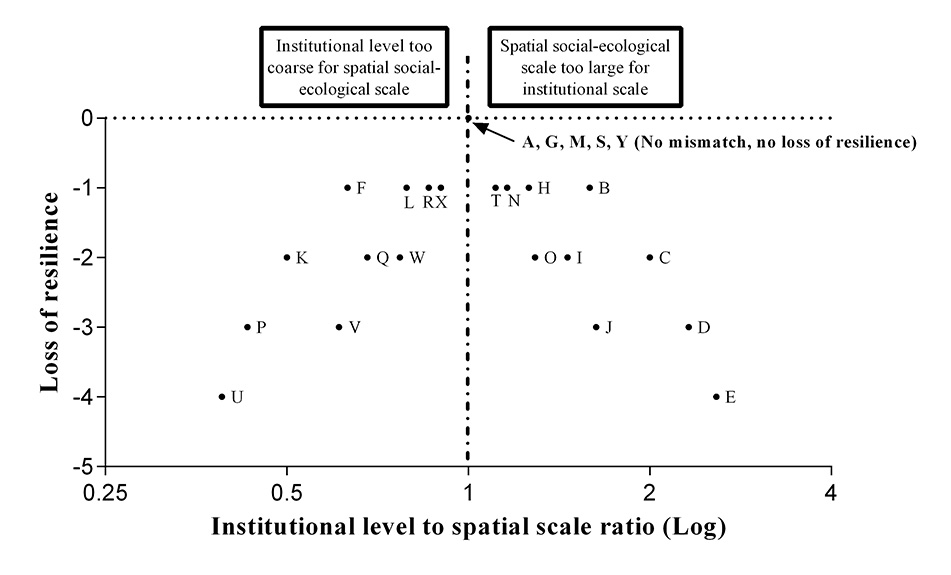
This appendix contain a step-by-step description of the methodology used by Maciejewski et al. to create Fig. 2 (Institutional/Spatial scale mismatch vs. loss in resilience)
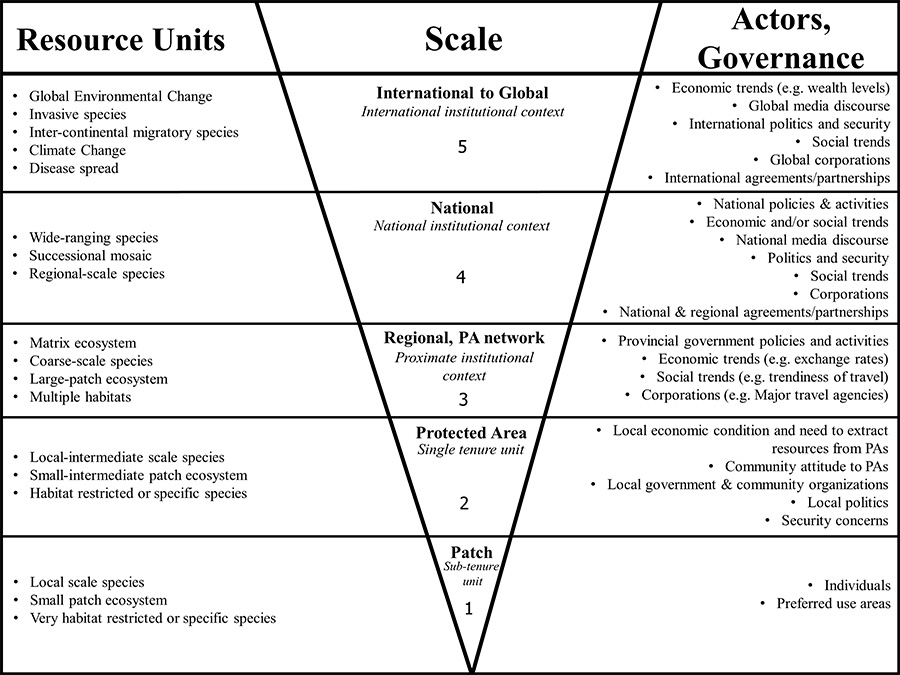
Step 1: Define element A (institutional level) and B (spatial scale) for a particular scenario in a particular system.
For example, endemic species in the Galapagos are being outcompeted by invasive species introduced by vessels delivering tourists to the Islands. This leads to changes in ecosystem communities, structure and function, which in turn affects the "quality" of nature on offer to tourists.
• Element A: Institution Level = International Tourism and Travel
• Element B: Spatial Scale = Habitat-restricted/specific species
Step 2: Note the scales at which A or B exist and calculate scale-mismatch ratio.
In this example, Element A exist at the International Level (5) and element B exist at the Protected Area spatial scale (2). This gives a scale-mismatch ratio of:
![]()
Step 3: Score the "system" for resilience reduced, based on this scale:
In this example, there was a loss of critical components, disruption in SES functioning, and inefficiencies occurred. Here we scored it -3.
Scale |
Reduction in Resilience |
0 |
Resilience unaffected or positively affected |
1 |
Mild inefficiencies occur |
2 |
Critical component loss or functioning of SES disrupted |
3 |
Critical component loss, functioning of SES disrupted, inefficiencies occur |
4 |
Multiple components loss, inefficiencies occur, functions of SES disrupted |
5 |
Catastrophic |
Step 4: Plot Resilience vs. Scale Mismatch
We repeated the above process for all scenarios in Table 1, and plotted this scale-mismatch ratio against resilience lost (subjectively scored against the defined scale), to produce the plot seen in Fig. 2.