Ecological Archives A025-001-A1
Tamera J. Minnick and Richard D. Alward. 2015. Plantsoil feedbacks and the partial recovery of soil spatial patterns on abandoned well pads in a sagebrush shrubland. Ecological Applications 25:310. http://dx.doi.org/10.1890/13-1698.1
Appendix A. Tables showing research site descriptions, weather station summaries, model parameters and statistics, and figures showing a map of study sites and weather stations and sampling protocol.
Table A1. Research site descriptions, including location, elevation, current status and soil characteristics.
Site Name1 |
Recovery Time2 (years) |
Easting3 (m) |
Northing3 (m) |
Elevation (m) |
Status4 |
Soil Map Unit5 |
Soil Texture6 |
Soil Color6 |
pH6 |
Conductivity6 (µS/cm) |
Ref A |
NA |
728452 |
4417686 |
2030 |
Undisturbed Reference |
Yamac loam |
silt loam |
10YR 3/4 |
7.3 |
191 |
Ref B |
NA |
730314 |
4419340 |
1976 |
Undisturbed Reference |
Rentsac channery loam |
sandy loam |
10YR 3/3 |
7.3 |
280 |
1961 |
47 |
728179 |
4417142 |
2020 |
Dry & Abandoned |
Rentsac channery loam |
loamy sand |
10YR 5/3 |
8.0 |
244 |
1971 |
37 |
725454 |
4416402 |
2050 |
Producing |
Redcreek-Rentsac complex |
sandy loam |
10YR 5/3 |
8.1 |
266 |
1976 |
32 |
725334 |
4415664 |
2038 |
Plugged & Abandoned |
Rentsac channery loam |
sandy loam |
10YR 4/4 |
8.1 |
249 |
1982 |
26 |
728480 |
4418778 |
2015 |
Plugged & Abandoned |
Rentsac channery loam |
sandy loam |
10YR 4/3 |
8.2 |
220 |
1995 |
13 |
724641 |
4413002 |
2072 |
Producing |
Rentsac channery loam |
sandy loam |
10YR 5/3 |
8.0 |
359 |
2000 |
8 |
730458 |
4418646 |
1977 |
Shut In |
Rentsac channery loam |
sandy loam |
10YR 4/3 |
8.1 |
296 |
2004 |
4 |
730076 |
4418507 |
1972 |
Abandoned Location |
Rentsac channery loam |
sandy loam |
10YR 4/3 |
8.1 |
318 |
2008 |
0 |
728940 |
4418011 |
2020 |
Producing |
Redcreek-Rentsac complex |
sandy loam |
10YR 4/4 |
7.8 |
456 |
1 Site names as used in text and figures. Ref A & B are the two undisturbed reference sites. Well pad names refer to the year in which the site was reclaimed or abandoned.
2 Growing seasons elapsed since the well pad was abandoned or reclaimed. NA= not applicable since these reference sites had not been recently disturbed.
3 Post-processed UTM data, datum = NAD83, zone = 12S
4 Drilling and production status as reported by the Colorado Oil and Gas Conservation Commission (http://cogcc.state.co.us). Dry & Abandoned: The well did not produce commercial quantities of gas and was plugged and abandoned in compliance with all then applicable regulations. Plugged & Abandoned: The well is plugged and abandoned as above after commercial production ceased. Producing: The well is currently producing commercial quantities of gas; unused areas of the well pad have undergone interim reclamation. Shut In: The well is capable of producing but is not presently producing. Abandoned Location: A well pad was cleared but no well was drilled.
5 Additional soil information: Soils at the sites are primarily Redcreek-Rentsac Complex (5–30 % slopes) with some Rentsac channery loam (5–50 % slopes), and Yamac loam (2–15 % slopes) (USDA, NRCS 2009). The Redcreek soil map unit is a sandy loam from eolian deposits or residuum weathered from sandstone, the Rentsac soil map unit is a loam texture that is residuum weathered from calcareous sandstone, and the Yamac map unit is a loam texture from alluvium or eolian deposits. All are well-drained, non-saline to very slightly saline, and about 40 cm to bedrock.
6 We collected and mixed together an additional four soil samples from each plot corner; samples from this composite soil were analyzed for a site description of soil texture, color, pH and conductivity. Soil color was determined using Munsell Soil Color Charts (2009). Reference site soils were dark brown or dark yellowish brown, well pad soils were brown or dark yellowish brown. Soils on well pads were typically thin and rocky; thus, the volume of soil collected was inconsistent and so we did not convert our findings to an area basis. In a separate study, we determined soil textures and an estimate of bulk density for each of the 112 soil samples from the Reference A and 1976 sites. Soil texture exhibited minor variation (loam to sandy loam or, rarely, clay loam), and bulk density was estimated to have minimal variation of between 1.32–1.45 g/cm3 (T. J. Minnick and R. Young, unpublished data).
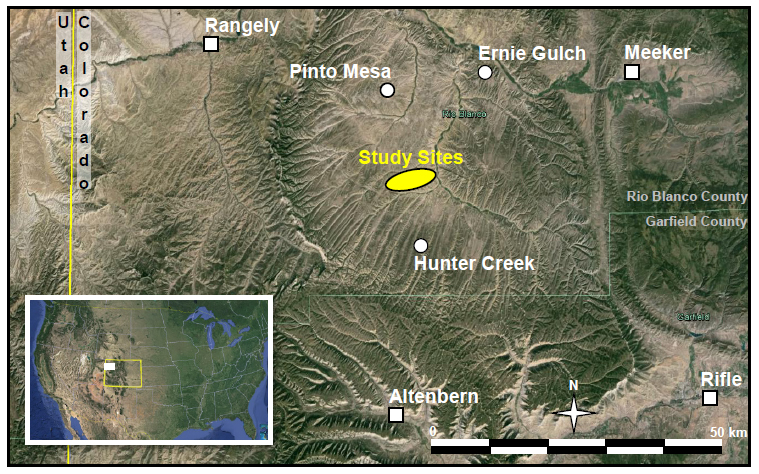
Fig. A1. Locations of study sites and weather stations in Rio Blanco and Garfield Counties in northwestern Colorado, USA. Squares indicate weather stations with long-term records (>30 yrs); circles indicate weather stations with only 5 yrs of records. Inset of United States indicates location of Colorado (in yellow) and the area depicted in the main map (in white). Map data from Google; Landsat imagery.
Table A2. Location information for seven weather stations and annual average climate data from four weather stations with long-term data (30 yrs) within 60km of study sites and from three weather stations with short-term data (5 yrs) within 22 km of the study sites.*
Station |
Station |
Observation Period |
Latitude (ºN) |
Longitude (ºE) |
Elevation (m) |
Distance (km) |
Direction (º) |
TMAX (ºC) |
TAVE (ºC) |
TMIN (ºC) |
Ppt (mm) |
Altenbern |
50214 |
1981–2010 |
39.50 |
108.38 |
1734 |
42 |
186 |
17.2 |
8.3 |
-0.6 |
455 |
Meeker |
55484 |
1981–2010 |
40.03 |
107.90 |
1902 |
45 |
65 |
14.7 |
5.4 |
-3.9 |
443 |
Rangely |
56832 |
1981–2010 |
40.08 |
108.77 |
1612 |
44 |
301 |
16.5 |
8.0 |
-0.5 |
291 |
Rifle |
57031 |
1981–2010 |
39.53 |
107.80 |
1622 |
60 |
130 |
19.2 |
9.7 |
0.1 |
342 |
Ernie Gulch |
MEGRC2 |
2008–2012 |
40.05 |
108.20 |
2132 |
22 |
31 |
13.9 |
8.0 |
2.4 |
274 |
Hunter Creek |
MHCKC2 |
2008–2012 |
39.77 |
108.33 |
2230 |
12 |
180 |
15.9 |
7.7 |
1.4 |
325 |
Pinto Mesa |
MPIRC2 |
2008–2012 |
40.02 |
108.40 |
2032 |
17 |
340 |
15.5 |
8.2 |
1.5 |
247 |
* Long-term weather station data from the Western Regional Climate Center [http://www.wrcc.dri.edu/summary/Climsmco.html]. Short-term weather station data from Weather Underground [http://www.wunderground.com/].
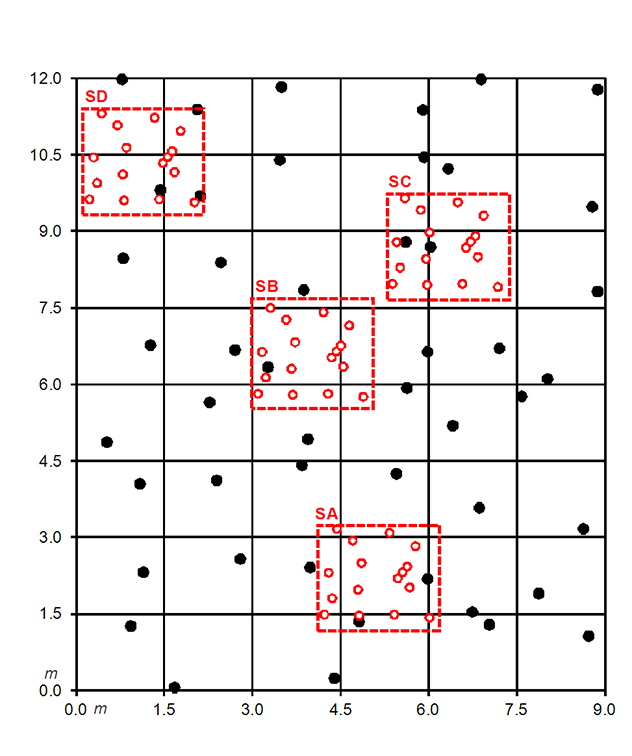
Fig. A2. Schematic of the spatially explicit sampling protocol. Main plots were divided into forty eight 1.5 × 1.5 m grid cells and we randomly located a sampling point within each cell. Four subplots, each 2 × 2 m, were overlaid on each main plot, and we randomly located an additional 16 sampling points within each. We used several criteria for determining plot location to minimize potentially confounding variables. Plots were located in an area that appeared to have made the greatest vegetation recovery. In order to avoid topographically-induced resource gradients that would influence the geostatistical analysis, we located the main plot in a level area with no evidence of erosion. We avoided areas with continued disturbance, low total plant cover, or high weed cover. We selected reference sites in sagebrush communities since the disturbed sites had all been located in sagebrush communities or sagebrush/pinyon-juniper ecotones.
Table A3. Model parameters and statistics derived from semi-variogram analysis1 of soil organic carbon (SOC) and the proportion (r²) of total variation accounted for by a spherical model for each site.
Site Name |
Range; A0 (m) |
Nugget Variance; C0 (g/kg) |
Sill Variance; C0+C (g/kg) |
Proportion; C0/(C0+C) |
r² |
Spatial pattern at the size of plants/interspaces?2 |
Ref A |
0.74 |
0.001 |
0.951 |
0.999 |
0.50 |
Yes |
Ref B |
2.10 |
0.233 |
0.981 |
0.762 |
0.57 |
Yes |
1961 |
0.13 |
0.089 |
1.036 |
0.914 |
0.00 |
No spatial pattern, random |
1971 |
0.14 |
0.001 |
0.943 |
0.999 |
0.00 |
No spatial pattern, random |
1976 |
2.80 |
0.492 |
1.033 |
0.524 |
0.49 |
Some spatial pattern, but large nugget variance |
1982 |
> 7.0 |
0.335 |
1.252 |
0.732 |
0.79 |
Spatial pattern, but large range |
1995 |
6.64 |
0.423 |
1.171 |
0.639 |
0.75 |
Spatial pattern, but large range |
2000 |
> 7.0 |
0.619 |
1.24 |
0.501 |
0.72 |
Spatial pattern, but large range |
2004 |
0.86 |
0.338 |
1.04 |
0.676 |
0.47 |
Some spatial pattern, but large nugget variance |
2008 |
6.16 |
0.393 |
1.02 |
0.614 |
0.78 |
Spatial pattern, but large range |
1 Schlesinger et al. (1996) found that on level sites, an isotropic spherical model can be used to detect spatial autocorrelation. In the semi-variogram analysis, the separation distance (h; the horizontal distance between two sample points), is the independent variable. The dependent variable, semivariance (γ), is calculated based on the difference in sample values (SOC). Because we sampled with the same protocol as Schlesinger et al. (1996), we also adopted their analysis methods, using interval categories of 20 cm separation distances from 0 to 7 m (half the maximum distance between two sampling points). The resultant model identifies a range (A0; the distance at which the two point values are no longer correlated), the nugget variance (C0; the smallest difference between SOC values that is predicted), and spatial variance (C; the largest difference between SOC values that is predicted). The proportion of variance that is due to spatial autocorrelation is calculated as C/(C0+C). The r2 for the relationship indicates the proportion of variance explained by spatial autocorrelation.
2 The final column summarizes whether the analysis indicates significant autocorrelation associated with plants on site, or if not, whether SOC is distributed randomly or if any autocorrelation is at a scale smaller than the sampling distances (i.e., large nugget variance) or at a scale greater than the plants on site (i.e., large range).
Table A4. Model parameters and statistics derived from cross-covariate semi-variogram analyses of SOC with the presence or absence of shrubs or perennial grasses.1
|
|
SOC Covariation with Shrub Presence |
|
SOC Covariation with Perennial Grass Presence |
||||||
Site Name |
|
Range; A0 (m) |
Sill Variance; C0+C (g/kg) |
r² |
Spatial pattern at the size of plants/interspaces?2 |
|
Range; A0 (m) |
Sill Variance; C0+C (g/kg) |
r² |
Spatial pattern at the size of plants/interspaces? 2 |
Ref A |
|
0.71 |
0.285 |
0.50 |
Yes |
|
0.38 |
-0.081 |
0.05 |
No spatial pattern, random |
Ref B |
|
1.03 |
0.238 |
0.61 |
Yes |
|
0.81 |
-0.115 |
0.44 |
Spatial pattern but a negative relationship |
1961 |
|
1.35 |
0.207 |
0.42 |
Yes |
|
> 7.0 |
0.051 |
0.52 |
Spatial pattern, but large range |
1971 |
|
0.23 |
0.180 |
0.02 |
No spatial pattern, random |
|
0.64 |
-0.041 |
0.25 |
No spatial pattern, random |
1976 |
|
0.88 |
0.127 |
0.19 |
Some spatial pattern, but low r² |
|
> 7.0 |
-0.001 |
0.33 |
Spatial pattern, but large range |
1982 |
|
1.62 |
0.115 |
0.36 |
Yes |
|
> 7.0 |
0.127 |
0.52 |
Spatial pattern, but large range |
1995 |
|
1.42 |
0.133 |
0.13 |
Some spatial pattern, but low r² |
|
> 7.0 |
0.010 |
0.48 |
Spatial pattern, but large range |
2000 |
|
0.33 |
0.035 |
0.07 |
No spatial pattern, random |
|
0.13 |
0.062 |
0.00 |
No spatial pattern, random |
2004 |
|
0.32 |
-0.004 |
0.001 |
No spatial pattern, random |
|
N/A |
N/A |
N/A |
No perennial grasses at site |
1 The six sample locations, out of 1008 total samples, that were under trees were grouped together with shrubs and the nine samples located under perennial forbs were combined with perennial grasses. The 108 samples that were located under an invasive annual grass, Bromus tectorum (L.) were combined into the between plants group since these plants have little in the way of canopy or root biomass.
2 The final column for both the shrub and perennial grass semi-variogram results summarizes whether the analysis indicates significant autocorrelation associated with plants on site, or if not, whether SOC is distributed randomly or if any autocorrelation is at a scale smaller than the sampling distances (i.e., large nugget variance) or at a scale greater than the plants on site (i.e., large range).
Literature cited
Munsell Soil Color Charts. 2009. Munsell Color, Grand Rapids, Michigan, USA.
Schlesinger, W.H., J.H. Raikes, A.E. Hartley and A.F. Cross. 1996. On the spatial pattern of soil nutrients in desert ecosystems. Ecology 77:364–374.
United States Department of Agriculture, Natural Resources Conservation Service. 2009. Web Soil Survey. Retrieved from http://websoilsurvey.nrcs.usda.gov; accessed 10 Feb 2010.
Weather Underground. 2013. Weather History. Retrieved from http://www.wunderground.com/; accessed 11 Dec 2013.
Western Regional Climate Center. 2013. Colorado Climate Summaries. Retrieved from http://www.wrcc.dri.edu/summary/climsmco.html; accessed 11 Dec 2013.