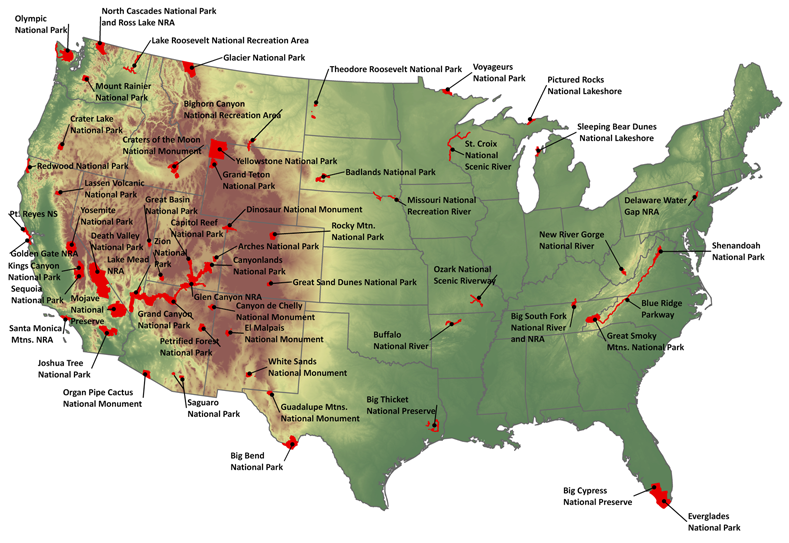
Appendix A. A figure of the final US National Park Service units used in the analysis and a table showing park area, protected-area centered ecosystem (PACE) area, and PACE:park ratio for those park units.
FIG. A1. Locations of National Park Service units for which land use was analyzed (NS = national seashore and NRA = national recreation area). Click image for larger version.
TABLE A1. Characteristics of parks and protected-area centered ecosystems. Parks are listed in ascending order of park area.
| Park |
Park area (km²) |
PACE area (km²) |
PACE:Park ratio |
| Delaware Water Gap | 278 | 6,679 | 24 |
| Missouri River | 279 | 19,828 | 71 |
| Sleeping Bear Dunes | 284 | 4,686 | 16 |
| New River Gorge | 285 | 8,037 | 28 |
| Theodore Roosevelt | 285 | 8,661 | 30 |
| Pictured Rocks | 298 | 5,072 | 17 |
| Arches | 309 | 8,867 | 29 |
| Great Basin | 312 | 6,428 | 21 |
| Ozark | 333 | 9,496 | 29 |
| Guadalupe Mountains | 356 | 7,467 | 21 |
| Big Thicket | 359 | 11,780 | 15 |
| Blue Ridge Parkway | 366 | 29,734 | 81 |
| Canyon de Chelly | 375 | 6,858 | 18 |
| Saguaro | 378 | 7,907 | 48 |
| Buffalo River | 389 | 12,050 | 31 |
| Saint Croix | 396 | 19,125 | 21 |
| Lake Roosevelt | 424 | 16,512 | 39 |
| Lassen Volcanic | 434 | 3,761 | 9 |
| Redwood | 468 | 7,082 | 15 |
| El Malpais | 473 | 8,209 | 17 |
| Bighorn Canyon | 484 | 15,564 | 33 |
| Big South Fork | 496 | 7,322 | 32 |
| Great Sand Dunes | 496 | 8,795 | 18 |
| Zion | 598 | 8,675 | 14 |
| Point Reyes, Golden Gate | 617 | 6,215 | 10 |
| White Sands | 617 | 10,335 | 17 |
| Santa Monica Mountains | 619 | 5,767 | 9 |
| Crater Lake | 736 | 4,928 | 7 |
| Shenandoah | 782 | 10,752 | 14 |
| Voyageurs | 829 | 9,339 | 11 |
| Dinosaur | 853 | 18,380 | 22 |
| Petrified Forest | 903 | 10,229 | 11 |
| Mount Rainier | 952 | 5,954 | 6 |
| Badlands | 982 | 14,800 | 15 |
| Rocky Mountain | 1,080 | 8,478 | 8 |
| Organ Pipe Cactus | 1,338 | 11,191 | 8 |
| Craters of the Moon | 1,901 | 16,645 | 9 |
| Great Smoky Mountains | 2,098 | 15,640 | 7 |
| North Cascades Complex | 2,756 | 15,293 | 6 |
| Joshua Tree | 3,211 | 22,373 | 7 |
| Big Bend | 3,291 | 26,666 | 8 |
| Olympic | 3,700 | 19,885 | 5 |
| Glacier | 4,080 | 22,067 | 5 |
| Mojave | 6,433 | 21,832 | 3 |
| Yosemite, Sequoia-Kings Canyon | 6,521 | 19,905 | 3 |
| Everglades, Big Cypress | 9,179 | 24,101 | 3 |
| Yellowstone, Grand Teton | 10,159 | 33,557 | 3 |
| Death Valley | 13,764 | 58,319 | 4 |
| Colorado River� | 18,295 | 97,574 | 5 |
| Mean | 2,140 | 15,486 | 18 |
| Median | 617 | 10,335 | 15 |
�Colorado River parks are: Canyonlands, Capitol Reef, Glen Canyon, Grand Canyon, and Lake Mead.