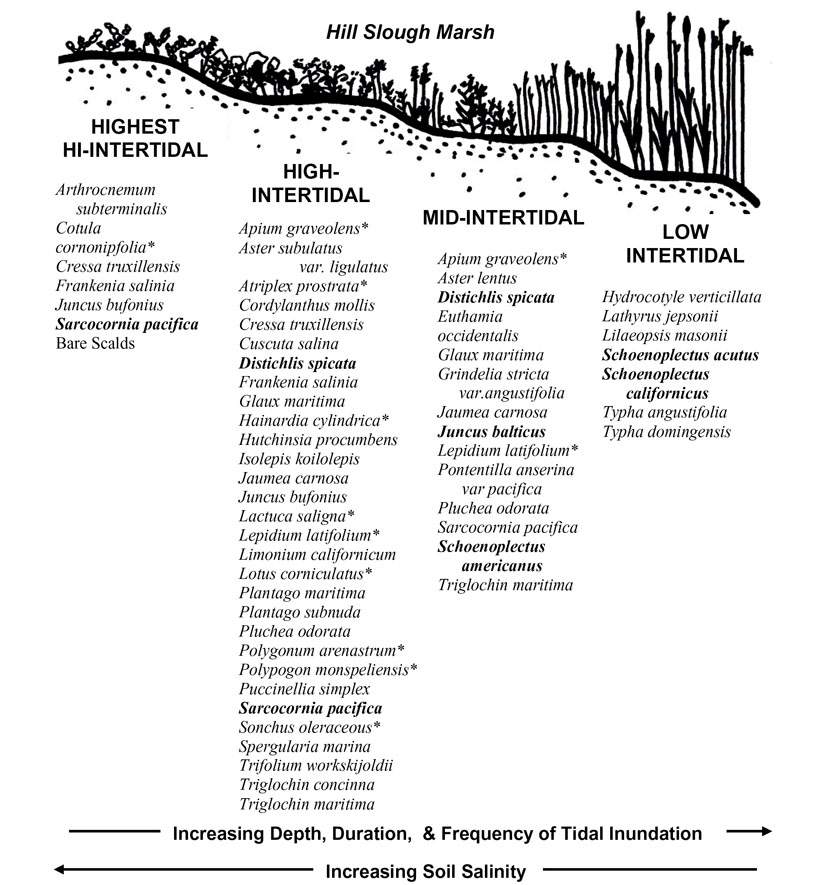
Appendix B. Schematic diagrams of the salt marsh intertidal gradient at study sites illustrating differences in physical conditions and plant species occurrence and dominance among major vegetation zones.
FIG. B1. Schematic diagram of the intertidal gradient at Hill Slough (San Francisco Estuary) illustrating differences in plant species occurrence among major vegetation zones and physical conditions considered in this study. Dominant species indicated by bold type, exotic species by * symbol. |
FIG. B2. Schematic diagram of the intertidal gradient at Tom’s Point (Tomales Bay Estuary) salt marsh illustrating differences in plant species occurrence among major vegetation zones and physical conditions considered in this study. Dominant species indicated by bold type, exotic species by * symbol. |