Appendix I. Model validation.
Here we compare our model's predictions of cross-pollination with empirical data, according to the relative compass orientation of the GM and non-GM fields. There are no published studies at the appropriate scale and replication that could fully support this comparison. Instead, they concern single pollinating plots surrounded by small pollen-receiving plots. Using these limited data, we demonstrate consistency between observation and model predictions in all cases where comparisons are possible (for three of the crops). We consider each crop in turn.
Oilseed rape
The relative degree of cross-pollination in oilseed rape due to the wind and to insects is currently unknown. Hence it is not possible to compare empirical levels of cross-pollination by compass direction with the model predictions.
Maize
We are aware of little empirical data that can be used to compare with the model predictions, although Ma et al. (2004) measured the cross-pollination rate in maize upwind and downwind of the prevailing wind direction, for each of three sites and for two or three years at each site (Table I1). The source plot was 27 × 27 m, and the sink plants were in rows at distances of 0.76 m to 40 m from the source plot.
In summary, when the distance between source and sink is 0.76 m, the model predicts that cross-pollination rates for maize in Europe vary by a factor of between 13 and 23. The observed relative cross-pollination rates vary by 1 to 13, not far different from the predicted range. At greater distances, the model predicts that cross-pollination rates vary by a factor of between 50 and 2600. The maximum observed ratio of cross-pollination rates of 62 is consistent with the prediction. The details of these calculations follow.
To compare the actual vs. model predicted relative cross-pollination rates, it is necessary to have estimates of the following parameters (Appendix B);
To estimate (2), it is strictly necessary to apply one of the methods described by Lavigne et al. (1998) for a non-singular source plot. However as an approximation, we fitted the negative exponential distribution to cross-pollination rates based on the distance from the edge of the source plot. This gave ![]() = 1/0.41 = 2.4 m downwind and 1/0.65 = 1.5 m upwind (Ma et al. 2004). Assuming
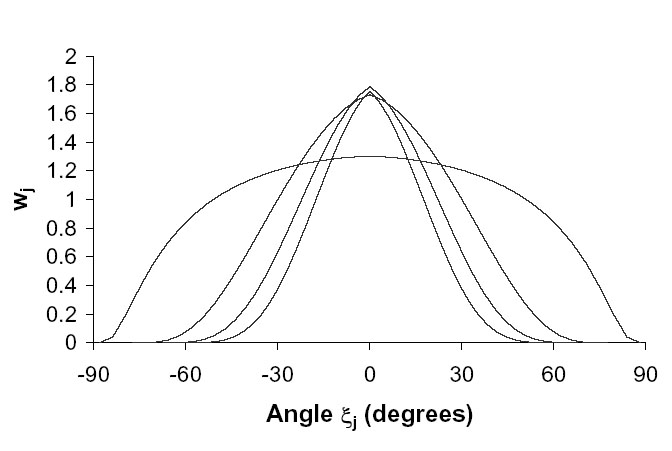
= 1/0.41 = 2.4 m downwind and 1/0.65 = 1.5 m upwind (Ma et al. 2004). Assuming ![]() = 2 m, then the weighting function, wj, (Eq. A.6d) is displayed in Fig. I1. The approximation for close, long fields (Appendix B) will be reasonably accurate when the distance between source and sink is 0.76 m, but will underestimate the variance of the cross-pollination rates as the distance increases. Then, the model predicts that the cross-pollination rate for maize in Europe, varies by a factor of between 13 to 23 depending on whether pollen release is adjusted for wind speed, and depending on the degree of pollen lateral diffusion. The observed relative cross-pollination rates at 0.76 m vary from 1 to 13 (Table I1), not far different from the range 13 to 23 above. In the case of distant, narrow fields, we assumed that wj is a constant over the range [-5º<
= 2 m, then the weighting function, wj, (Eq. A.6d) is displayed in Fig. I1. The approximation for close, long fields (Appendix B) will be reasonably accurate when the distance between source and sink is 0.76 m, but will underestimate the variance of the cross-pollination rates as the distance increases. Then, the model predicts that the cross-pollination rate for maize in Europe, varies by a factor of between 13 to 23 depending on whether pollen release is adjusted for wind speed, and depending on the degree of pollen lateral diffusion. The observed relative cross-pollination rates at 0.76 m vary from 1 to 13 (Table I1), not far different from the range 13 to 23 above. In the case of distant, narrow fields, we assumed that wj is a constant over the range [-5º< ![]() <5 º ] (Appendix B), and zero elsewhere. Then, the cross-pollination rate varies by a factor of between 50 and 2600. At greater distances, relative cross-pollination tends to increase, as predicted by our model, and the maximum observed ratio of cross-pollination rates of 62 is approximately below the upper bound. Note that the ratios of measured cross-pollination rates may be less reliable at greater distances, since the absolute rates are smaller. The assumption of distant, narrow fields is too extreme, since the sink plants would need to be approximately 200 m from the source in order to obtain a range of angles of 10º between source and sink.
<5 º ] (Appendix B), and zero elsewhere. Then, the cross-pollination rate varies by a factor of between 50 and 2600. At greater distances, relative cross-pollination tends to increase, as predicted by our model, and the maximum observed ratio of cross-pollination rates of 62 is approximately below the upper bound. Note that the ratios of measured cross-pollination rates may be less reliable at greater distances, since the absolute rates are smaller. The assumption of distant, narrow fields is too extreme, since the sink plants would need to be approximately 200 m from the source in order to obtain a range of angles of 10º between source and sink.
Ma et al. (2004) conducted the experiment in Canada, which is outside of the geographical area of our study. Nevertheless, given that relative cross-pollination rates are largely independent of country in Europe (main text), we assume that the analysis applies equally to Canada. Note also that the compass directions corresponding to the minimum and maximum cross-pollination rates need not necessarily coincide with the “upwind” and “downwind” directions specified in Ma et al. (2004). This implies that the measured cross-pollination rates will be less variable than those predicted by our model.
Sugar beet
We are aware of just a single study of cross-pollination of sugar beet at various compass directions from source plants (Saeglitz et al. 2000). The central source plot consisted of 30 transgenic sugar beet plants. Small sink plots, each of four male-sterile non-transgenic plants, were planted at each of eight compass directions and at each of several distances from the source plot. The percentage of seed from the bait plants that was GM was recorded for each sink plot. The experiment was conducted in Germany, which is within the area considered in our model.
In summary, the model predicts that the appropriate cross-pollination rates of sugar beet in Europe vary by a factor of between 12 and 111. The empirically measured factors of 56 and 10 are consistent with our model predictions. The details of these calculations follow.
Given that the cross-pollination rates were occasionally very high (up to 83%) (Table I2), we could not assume that the cross-pollination rates were proportional to pollen air density (as we can when cross-pollination rates are low). Specifically, we cannot assume that ![]() (density of GM pollen) is much smaller than
(density of GM pollen) is much smaller than ![]() (density of non-GM pollen) as we did in Eq. A.1. Suppose the cross-pollination rate at sink plot i is Ci. Then;
(density of non-GM pollen) as we did in Eq. A.1. Suppose the cross-pollination rate at sink plot i is Ci. Then;
|
where Gi and N are the densities of GM and non-GM pollen grains respectively at site i. Here we assume that N is the background density of non-GM pollen, and is constant at all sites. Then;
|
The factor ![]() /
/![]() for any distance from the source (Table I2) can be compared with the relative cross-pollination rates from the model.
for any distance from the source (Table I2) can be compared with the relative cross-pollination rates from the model.
We cannot calculate the factor ![]() /
/![]() at distances greater than 50m, since the minimum cross-pollination rate is zero (Table I2b). It should be noted that the sink plots are small, comprising only four male-sterile plants. To obtain a more reliable estimate of the minimum cross-pollination rate, it would be necessary to use many more plants at each plot. Closer (<50 m) to the GM source, the cross-pollination rates are much higher (Table I2a). The ratio
at distances greater than 50m, since the minimum cross-pollination rate is zero (Table I2b). It should be noted that the sink plots are small, comprising only four male-sterile plants. To obtain a more reliable estimate of the minimum cross-pollination rate, it would be necessary to use many more plants at each plot. Closer (<50 m) to the GM source, the cross-pollination rates are much higher (Table I2a). The ratio ![]() /
/![]() is 56 and 10 for the inner and outer ring of sink plots respectively (Table I2a).
is 56 and 10 for the inner and outer ring of sink plots respectively (Table I2a).
The source and sink plots consist of only a small number of plants. Hence we compare the empirical factors ![]() /
/![]() against the ratio of the maximum to minimum pollination by direction from the source assuming that the sink field subtends a narrow angle (10º) from the source field. This is the model assumption in the case of narrow, distant fields. The model predicts that the cross-pollination rate of sugar beet in Europe varies by a factor of between 12 and 111 depending on whether pollen release is adjusted for wind speed, and depending on the degree of pollen lateral diffusion. The empirically measured factors 56 and 10 (Table I2a) are below the upper bound of these estimates.
against the ratio of the maximum to minimum pollination by direction from the source assuming that the sink field subtends a narrow angle (10º) from the source field. This is the model assumption in the case of narrow, distant fields. The model predicts that the cross-pollination rate of sugar beet in Europe varies by a factor of between 12 and 111 depending on whether pollen release is adjusted for wind speed, and depending on the degree of pollen lateral diffusion. The empirically measured factors 56 and 10 (Table I2a) are below the upper bound of these estimates.
As mentioned in the case of Ma et al. (2004) above, although cross-pollination rates at several directions from the source plot were recorded, it is likely that the directions of least and greatest pollination were not captured. We would then expect measured values of ![]() /
/![]() to be lower than the values from the model.
to be lower than the values from the model.
There was a background level of non-transgenic pollen from neighbouring sugar beet fields, and from a source about 50 m from the source GM plot (Saeglitz et al. 2000). The relative cross-pollination rates should be directionally biased since this non-GM source was not close to the GM source plot. This should be borne in mind when comparing the actual vs. expected relative cross-pollination rates. Nevertheless, the results of Saeglitz et al. (2000) are consistent with the model predictions.
Rice
Two studies (Messeguer et al. 2001, Messeguer et al. 2004) found that cross-pollination in rice varied strongly according to the compass direction from the source plot. Both used small source plots, and short distances between source and sink plots. Here we present an outline of the method of comparison of the empirical results with the model predictions.
Messeguer et al. (2001) planted a small (diameter 3.5 m) circular GM rice source plot. The experiment was conducted in Spain, which is within the area analyzed by our model of rice pollen dispersal. At one site, the source plot was surrounded by a circle 1m from the edge of the plot. At a second site, the source plot was surrounded by a circle 5 m from the edge of the plot. There was a greater range of cross-pollination in the plants closest to the source plot (Table I3).
In summary, the model predicts that the appropriate cross-pollination rates of sugar beet in Europe vary by a factor of between 10 and 8600. The empirically measured factor of 75 is consistent with predictions. The details of these calculations follow.
In the analysis of the effect of the field geometry on the relative cross-pollination rate, we assumed that the source and sink fields were rectangular. In this case, the source plot is circular, and the sink plot is a single point. If an exact comparison to the model output were to be attempted, it would be necessary weight ![]() in Eq. A.6c by the relative number of plants in the source plot which are along the direction
in Eq. A.6c by the relative number of plants in the source plot which are along the direction ![]() j to the sink plant. Next, we would obtain the weights
j to the sink plant. Next, we would obtain the weights ![]() j in Eq. A.6c by multiplying this amount by a negative exponential distribution, with parameter
j in Eq. A.6c by multiplying this amount by a negative exponential distribution, with parameter ![]() .
. ![]() would be derived from the empirical data using Lavigne et al. (1998). The angle subtended by the source plot from the sink plots at distance 1 m is approximately 30º, and from the sink plots at distance 5 m approximately 65º. The corresponding angle assumed for distant, narrow field was 10º, and for close, long fields approximately 150º (Appendix B). As a rough approximation, we expect that the variability of the empirical cross-pollination rates will be not be as great as the variability of the rates from the model based on distant, narrow fields, but may exceed the variability based on the close, long fields. In the first case, the rates for Europe vary from 52 to 8600 depending on whether pollen release is adjusted for wind speed, and depending on the degree of pollen lateral diffusion. In the second case, the rates vary between 13 to 23. The empirical ratio of the maximum to minimum factors is 75 at distance 1 m. This ratio is not defined from at distance 5 m, since the minimum factor is zero (Table I3). The empirical ratio is then consistent with the model predictions.
would be derived from the empirical data using Lavigne et al. (1998). The angle subtended by the source plot from the sink plots at distance 1 m is approximately 30º, and from the sink plots at distance 5 m approximately 65º. The corresponding angle assumed for distant, narrow field was 10º, and for close, long fields approximately 150º (Appendix B). As a rough approximation, we expect that the variability of the empirical cross-pollination rates will be not be as great as the variability of the rates from the model based on distant, narrow fields, but may exceed the variability based on the close, long fields. In the first case, the rates for Europe vary from 52 to 8600 depending on whether pollen release is adjusted for wind speed, and depending on the degree of pollen lateral diffusion. In the second case, the rates vary between 13 to 23. The empirical ratio of the maximum to minimum factors is 75 at distance 1 m. This ratio is not defined from at distance 5 m, since the minimum factor is zero (Table I3). The empirical ratio is then consistent with the model predictions.
As mentioned above, although cross-pollination rates at several directions from the source plot were recorded, it is likely that the directions of least and greatest cross-pollination were not captured. We would then expect the empirical ratio of the maximum to minimum rates to be lower than the corresponding values from the model.
TABLE I1. Maize cross-fertilization rates (%) from Ma et al. (2004).
Year / Distance(m) |
2000 |
2001 |
2000 |
2001 |
2002 |
2000 |
2001 |
2002 |
Downwind |
||||||||
0.76 |
43.4 |
11.7 |
26.3 |
16.5 |
38.2 |
13.0 |
2.1 |
10.8 |
5.32 |
7.3 |
0.6 |
1.5 |
1.1 |
3.9 |
5.8 |
0.1 |
0.5 |
9.88 |
1.4 |
0.5 |
1.5 |
0.1 |
1.1 |
4.6 |
0.3 |
6.2 |
14.44 |
0.9 |
0.2 |
0.5 |
0.2 |
1.0 |
1.5 |
0.0 |
0.4 |
Upwind |
||||||||
0.76 |
11.3 |
1.9 |
2.2 |
21.7 |
2.9 |
12.4 |
18.4 |
6.7 |
5.32 |
0.3 |
0.4 |
0.03 |
0.9 |
0.2 |
3.2 |
1.0 |
0.9 |
9.88 |
0.04 |
0.1 |
0.04 |
1.2 |
0.1 |
0.9 |
2.0 |
0.1 |
14.44 |
0.04 |
1.0 |
0.07 |
0.3 |
0.05 |
0.7 |
1.3 |
0.1 |
Ratio (Larger / smaller) |
||||||||
0.76 |
4 |
6 |
12 |
1 |
13 |
1 |
9 |
2 |
5.32 |
24 |
2 |
50 |
1 |
20 |
2 |
10 |
2 |
9.88 |
35 |
5 |
38 |
12 |
11 |
5 |
7 |
62 |
14.44 |
23 |
5 |
7 |
2 |
20 |
2 |
- |
4 |
TABLE I2. Cross-pollination rates (%) (Ci) of sugar beet by distance and direction of sink rows from the source plot, for sink plants (a) close to and (b) further away from the source plot. Data from Saeglitz et al. (2000).
(a)
Direction from source |
|||||||||||||
Distance (m) |
A |
B |
C |
D |
E |
F |
G |
H |
I |
J |
Max |
Min |
G max / G min |
9 |
22 |
32 |
63 |
67 |
83 |
43 |
50 |
75 |
20 |
8 |
83 |
8 |
56 |
10 to 50 |
54 |
n/a |
50 |
23 |
32 |
n/a |
28 |
N/a |
75 |
n/a |
75 |
23 |
10 |
(b)
Direction from source |
||||||||||
Distance (m) |
N |
NE |
E |
SE |
S |
SW |
W |
NW |
Max |
Min |
50 |
23 |
20 |
9 |
10 |
7 |
0 |
0 |
n/a |
23 |
0 |
100 |
0 |
0 |
7 |
9 |
2 |
5 |
0.5 |
4 |
9 |
0 |
200 |
12 |
7 |
1 |
0 |
n/a |
40 |
0 |
0 |
40 |
0 |
300 |
0 |
0 |
0 |
0 |
0 |
0 |
0 |
0 |
0 |
0 |
TABLE I3. Cross-pollination rates (%) of rice by distance and compass direction from the GM source. Data from Messeguer et al. (2001).
Direction from source |
|||||||||||
Distance (m) |
N |
NE |
E |
SE |
S |
SW |
W |
NW |
Max |
Min |
Max / min |
1 |
0.141 |
0.015 |
0.007 |
0.015 |
0.007 |
0.022 |
0.029 |
0.526 |
0.526 |
0.007 |
75 |
5 |
0.022 |
0.006 |
0.014 |
0.006 |
0.000 |
0.022 |
0.006 |
0.014 |
0.022 |
0.000 |
n/a |
|
| FIG. I1. As the distance of the rows of sink plants from the source plot increases (0.76 m, 5.32 m, 9.88 m, and 14.44 m), the weighting function wj for the sink plants becomes more peaked. Data from Ma et al. (2004). |
LITERATURE CITED
Lavigne, C., E. K. Klein, P. Vallee, J. Pierre, B. Godelle, and M. Renard. 1998. A pollen-dispersal experiment with transgenic oilseed rape. Estimation of the average pollen dispersal of an individual plant within a field. Theoretical and Applied Genetics 96:886–896.
Ma, B. L., K. D. Subedi, and L. M. Reid. 2004. Extent of cross-fertilisation in maize by pollen from neighboring transgenic hybrids. Crop Science 44:1273–1282.
Messeguer, J., C. Fogher, E. Guiderdoni, V. Marfà, M. M. Català, G. Baldi, and E. Melé. 2001. Field assessments of gene flow from transgenic to cultivated rice (Oryza sativa L.) using a herbicide resistance gene as tracer marker. Theoretical and Applied Genetics 103:1151–1159.
Messeguer, J., V. Marfà, M. M. Català, E. Guiderdoni, and E. Melé. 2004. A field study of pollen-mediated gene flow from Mediterranean GM rice to conventional rice and the red rice weed. Molecular Breeding 13:103–112.
Saeglitz, C., M. Pohl, and D. Bartsch. 2000. Monitoring gene flow from transgenic sugar beet using cytoplasmic male-sterile bait plants. Molecular Ecology 9:2035–2040.