Appendix E. Effect of non-normal pollen release on relative cross-pollination rates.
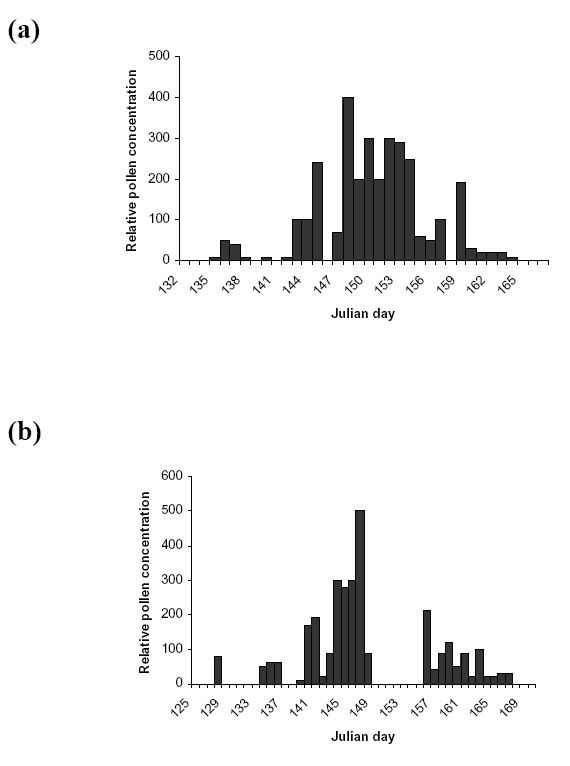
Empirical studies suggest that pollen release is influenced by the weather (McCartney and Lacey 1991, Bilsborrow et al. 1998). We attempted to quantify the effect of the day-to-day variability in pollen production (due to varying weather conditions) on the relative cross-pollination rates. McCartney and Lacey (1991) measured the seasonal variation in the 24-hour average oilseed rape pollen air concentration for each of five years (1985–1989) (Fig. E1). The mean concentration, averaged over the five years, is well described by a normal distribution (Fig. E1f), as assumed in our model (Eq. 3, main text). Nevertheless, the concentration in any single year does not vary smoothly from day to day (Fig. E1a-e).
We compared the relative cross-pollination rates assuming that pollen release (1) followed a normal distribution with variance s seasonal (Eq. 3, main text) with no allowance for wind speed, (2) the same, but with allowance for wind speed, and (3) was proportional to the pollen concentration successively for each of year 1985 to 1989 from McCartney and Lacey (1991). In all cases, we assumed that the seasonal relative receptivity of stigmas could still be described by a normal distribution with variance ![]() (Eq. 4, main text). This method was applied to winter oilseed rape separately to each of the following UK locations and years: Bedford (1995), Nottingham (1998), Leeds (1999), Perth (1995), Larkhill (1999).
(Eq. 4, main text). This method was applied to winter oilseed rape separately to each of the following UK locations and years: Bedford (1995), Nottingham (1998), Leeds (1999), Perth (1995), Larkhill (1999).
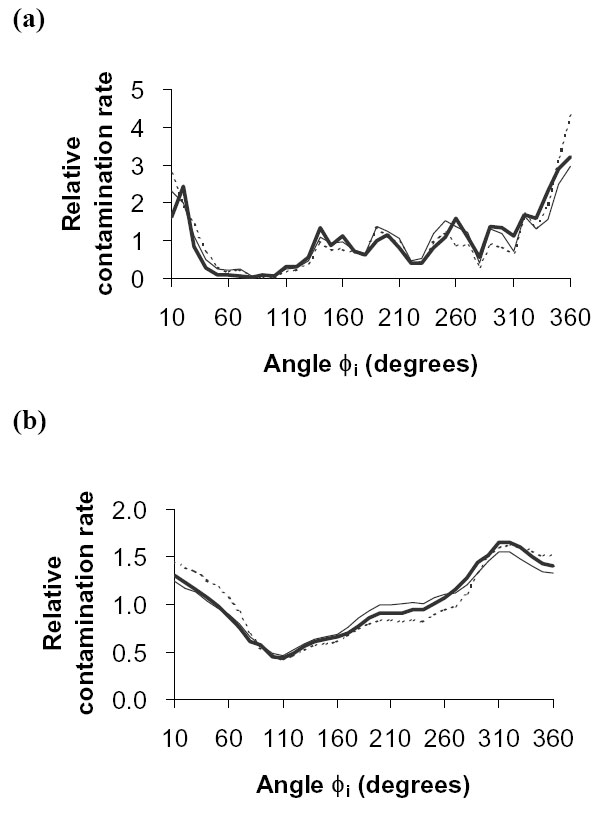
The relative cross-pollination rates on basis (3) generally fell within the range of (1) and (2), regardless of the degree of lateral spread of pollen (![]() ) (Figs. E2, E3). We therefore concluded that the assumption that seasonal pollen release follows a normal distribution is adequate to obtain robust estimates of the relative cross-pollination rates.
) (Figs. E2, E3). We therefore concluded that the assumption that seasonal pollen release follows a normal distribution is adequate to obtain robust estimates of the relative cross-pollination rates.
|
|
|
| FIG. E1. Relative 24-hour average pollen concentration for (a) 1985, (b) 1986, (c) 1987, (d) 1988, (e) 1989, (f) average over 1985–1989 from McCartney and Lacey (1991), with best fit to normal distribution. |
|
| FIG. E2. Comparison of mean maximum (maxi[C( |
|
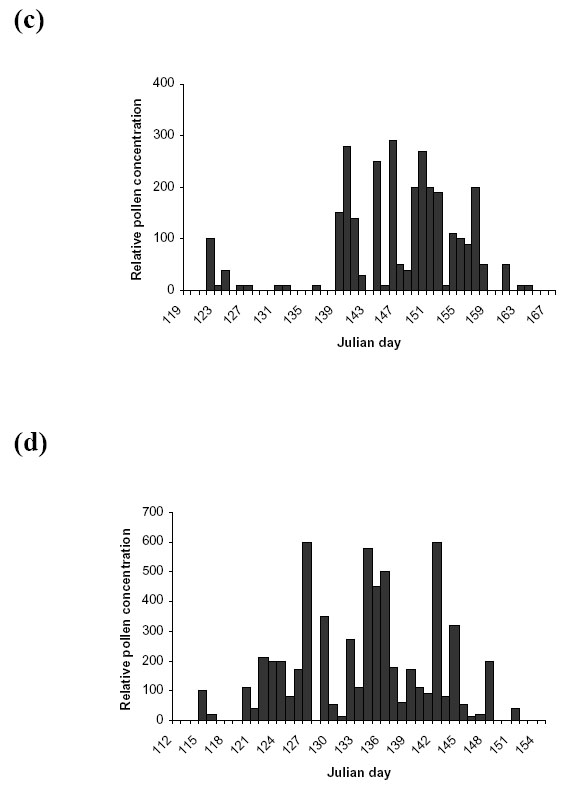
| FIG. E3. Comparison of relative contamination rates for Nottingham in the year 1998, assuming pollen release (1) from McCartney and Lacey (1991) (from 1987; Fig. E1c) (thick solid line), (2) follows a normal distribution with no allowance for speed (thin, continuous line), and (3) follows a normal distribution with allowance for speed (broken line) for (a) distant, narrow fields and (b) close, long fields. |
LITERATURE CITED
Bilsborrow, P. E., E. J. Evans, J. Bowman, and B. F. Bland 1998. Contamination of edible double-low oilseed rape crops via pollen transfer from high erucic cultivars. Journal of the Science of Food and Agriculture 76:17–22.
McCartney, H. A., and M. E. Lacey. 1991. Wind dispersal of pollen from crops of oilseed rape (Brassica napus L.). Journal of Aerosol Science 22:467–477.