 .
.
(A.1)
Appendix A. Cross-pollination rate approximation.
In this section, we show that, for the four crops studied, approximately;
|
.
|
(A.1) |
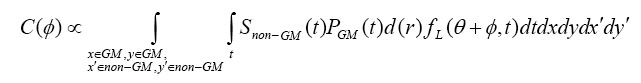
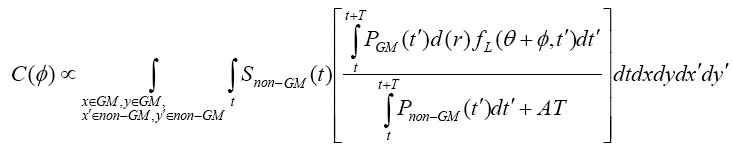
The relative cross-pollination rate as a function of the angle ![]() between the GM and non-GM fields, is given in the main text as;
between the GM and non-GM fields, is given in the main text as;
 .
.
|
(A.2) |
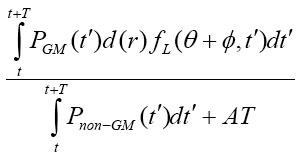
The cross-pollination rate of the seeds produced by a flower whose stigma is receptive to pollen over the time interval [t,t+T] is the term in brackets;
|
(A.3) |
Snon-GM(t) is the number of receptive stigmas in the non-GM field at time t. PGM(t) and Pnon-GM(t) are the airborne concentrations of GM and non-GM pollen above their respective fields of origin at time t. A is the mean rate of deposition of pollen from the same plant (selfed pollen), where this pollen is self-compatible. (x,y) and (x´,y´) are coordinates in the GM and non-GM fields respectively. d(r) relates the decline in pollen dispersal with distance from the source, r, where ![]() .
. 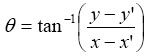 . The proportion of the total amount of GM pollen deposited at distance r from the source at time t, which is at angle
 ![]() is
is ![]() .
.
T similar to period of flowering (maize, sugar beet)
Maize and sugar beet stigmas are receptive to pollen over a period similar to the seasonal period of flowering. Maize stigmas are receptive for approximately 6 days (Bassetti and Westgate 1993). ![]() is approximately 2.5 days (Table A1), giving a peak flowering period of approximately 5 days (± 1 standard deviation). Sugar beet stigmas are receptive for approximately 14 days ( McGregor 1976 ).
is approximately 2.5 days (Table A1), giving a peak flowering period of approximately 5 days (± 1 standard deviation). Sugar beet stigmas are receptive for approximately 14 days ( McGregor 1976 ). ![]() is approximately 7.9 days (see above), giving a peak flowering period of approximately 16 days.
is approximately 7.9 days (see above), giving a peak flowering period of approximately 16 days.
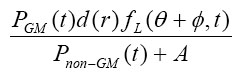
In this case 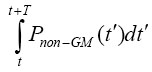 is approximately independent of t, and Eq. A.3 is approximately proportional to
 ![]() as a function of t. Substituting this into Eq. A.2, the cross-pollination rate is given as in Eq. A.1.
as a function of t. Substituting this into Eq. A.2, the cross-pollination rate is given as in Eq. A.1.
T much smaller than period of flowering (rice, oilseed rape)
Oilseed rape and rice stigmas are receptive to pollen over a far shorter period than the seasonal period of flowering. Rice stigmas are receptive for as little as six minutes to one hour per day (Grist 1953). ![]() is approximately 7.4 days (Table S1), giving a peak flowering period of approximately 14.8 days (± 1 standard deviation). For oilseed rape, stigmas are receptive for up to five days (Hayter and Cresswell 2006).
is approximately 7.4 days (Table S1), giving a peak flowering period of approximately 14.8 days (± 1 standard deviation). For oilseed rape, stigmas are receptive for up to five days (Hayter and Cresswell 2006). ![]() is approximately 7.8 days (Table S1), giving a flowering period of approximately 16 days (± 1 standard deviation).
is approximately 7.8 days (Table S1), giving a flowering period of approximately 16 days (± 1 standard deviation).
In this case the cross-pollination rate for a single stigma, receptive over the period [t,t+T] (Eq. A.3), is approximately
 .
.
|
(A.4) |
Given that the selfing rate for rice is very high, approximately 99% (Grist 1953), then A>>Pnon-GM(t), and Eq. A.4 is approximately proportional to ![]() . Substituting this into Eq. A.2, the cross-pollination rate is given as in Eq. A.1.
. Substituting this into Eq. A.2, the cross-pollination rate is given as in Eq. A.1.
Oilseed rape is pollinated by bees as well as by wind (Cresswell et al. 2004). In this case, the cross-pollination rate due to wind for a single oilseed rape stigma, receptive over the period [t,t+T], is approximately
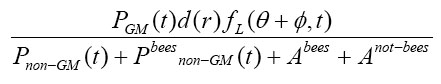 ,
,
|
(A.5) |
where Abees is the selfed pollen deposited by bees, Anot-bees is the selfed pollen not deposited by bees (deposited, e.g., by the flower’s own anthers brushing the stigma) and Pbeesnon-GM(t) is the non-selfed non-GM pollen deposited by bees. The selfing rate of oilseed rape is then
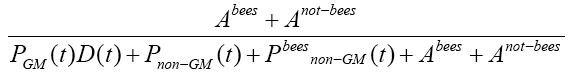 .
.
|
Observed values for the selfing rate are high, in the range 45–95% (Timmons et al. 1995). Hence, we assume that Pnon-GM(t) is small compared with
Pbeesnon-GM(t)+ Abees + Anot-bees, and Eq. A.5 is then approximately
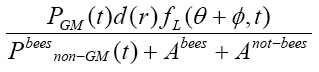 .
.
|
Substituting this into Eq. A.2, the cross-pollination rate is given as in Eq. A.1.
TABLE A1. Model parameter values of the crops estimated from empirical data.
|
Pollen release |
Stigma receptivity |
|||||
Crop |
Peak flowering date (tmax) |
|
|
Peak (hours) (hmax) |
|
Diurnal |
Peak (hours) (hmax) |
Sugar beet |
1st July |
7.9 |
2.8 |
11:00 |
7.9 |
constant |
n/a |
Oilseed rape |
15th April (winter oilseed rape), 15th June (spring oilseed rape) |
7.8 |
3.2 |
14:00 |
7.8 |
constant |
n/a |
Maize |
1st August |
2.5 |
2.0 |
12:00 |
2.5 |
constant |
n/a |
Rice |
15th August |
7.4 |
1.1 |
12:00 |
7.4 |
normal distribution, |
12:00 |
LITERATURE CITED
Bassetti, P., and M. E. Westgate. 1993. Senescence and receptivity of maize silks. Crop Science 33:275–278.
Cresswell, J. E., T. W Davies, M. A. Patrick, F. Russell, C. Pennel, M. Vicot, and M. Lahoubi. 2004. Aerodynamics of wind pollination in a zoophilous flower, Brassica napus. Functional Ecology 18:861–866.
Grist, D. H. 1953. Rice. Longmans, Green & Co., London, UK.
Hayter, K. E., and J. E. Cresswell. 2006. The influence of pollinator abundance on the dynamics and efficiency of pollination in arable Brassica napus: implications for landscape-scale gene dispersal. Journal of Applied Ecology 43:1196–1202.
McGregor, S. E. 1976. Insect pollination of cultivated crop plants. < http://gears.tucson.ars.ag.gov/book>
Timmons, A. M., E. T. O’Brien, Y. M. Charters, S. J. Dubbels, and M. J. Wilkinson. 1995. Assessing the risks of wind pollination from fields of genetically modified Brassica napus ssp. oleifera. Euphytica 85:417–423.